| Market dATA | |
| DJ Index | 100 points |
| Prices | |
| Base asset price | $10,000 |
| Put 100 | $1,000 |
Long “Covered” Put
Recommended use of strategy
Expectation of an increase in DJ Index, but with concern that the index could fall.
Strategy components
- Purchasing (Long) the base asset – the DJ Index or a mutual fund investing in the DJ shares (see page 9).
- Purchasing a Long Put option at a strike price equal to the DJ Index.
Example: Purchase (Long) the base asset at a price of $10,000 and purchase a Long Put 100 option for $1,000. The strategy is known as a Short Futures Contract since this combination creates an obligation (contract) to sell the DJ Index at the exercise date at its current price (100 points – $10,000).
Expenses / Income from building the strategy
Expenditure of $11,000.
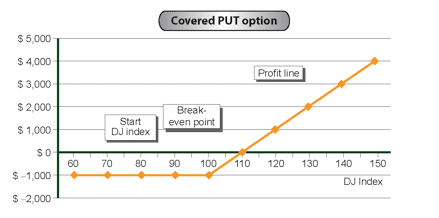
Strategy graph:

Auxiliary table for building the profit line
| DJ Index (Horizontal axis) |
(Fixed expenses)/ fixed income | Variable expenses (Put contribution) |
Base Asset contribution | Total profit / (loss) (Vertical axis) 2+3+4 |
| 1 | 2 | 3 | 4 | 5 |
| 60 | $11,000 | $4,000 | $6,000 | ($1,000) |
| 70 | $11,000 | $3,000 | $7,000 | ($1,000) |
| 80 | $11,000 | $2,000 | $8,000 | ($1,000) |
| 90 | $11,000 | $1,000 | $9,000 | ($1,000) |
| 100 | $11,000 | — | $10,000 | ($1,000) |
| 110 | $11,000 | — | $11,000 | $0 |
| 120 | $11,000 | — | $12,000 | $1,000 |
| 130 | $11,000 | — | $13,000 | $2,000 |
| 140 | $11,000 | — | $14,000 | $3,000 |
| 150 | $11,000 | — | $15,000 | $4,000 |
Strategy analysis:
Source of profit
The profit arises from the investment in the mutual fund. The profit increases as the index goes up.
Source of loss
Cost of building the strategy – $11,000. However when the DJ Index goes down, we lose on the mutual fund investment but are fully compensated by the Put option.
Break-even point
This occurs at index 110.
Comment
This strategy is a form of purchasing “insurance” against the risk of a fall in the value of the DJ Index shares basket.


