| Market dATA | |
| DJ Index | 100 points |
| Prices | |
| Call 100 | $1,000 |
| Put 90 | $1,800 |
| Call 110 | $500 |
Long “Butterfly”.
Recommended use of strategy
Expectation of stability of the DJ Index. This strategy is similar to the Short “Straddle” strategy, but the profit is smaller, if the forecast does come to fruition.
The loss is smaller too, of course, if our forecast does not come to fruition.
Strategy components
This strategy is a combination of 4 different Call options.
Writing 2 Call options of a strike price identical (or close to identical) to the current DJ Index (for example, call 100) and buying 2 different Call options, the first option with a strike price which is lower than the DJ Index (for example, 90) and the other option with a strike price which is higher than the index (for example, 110).
Comment: The difference in the strike price between the Call options we have bought and those we have written must be the same (in this case can be 90 and 110 or 80 and 120, etc.).
Expenses / Income from building the strategy
Expenditure of $300.
We will use, in this example, the options used in the previous strategy.
Assume that the cost of the Call 110 option is $500, the cost of the Call 90 option is $1,800, total $2,300. Cost of the Call 100 option is $1,000, in other words we receive $2,000 from the sale of 2 options. Total expenditure is $300 (2,300-2,000).
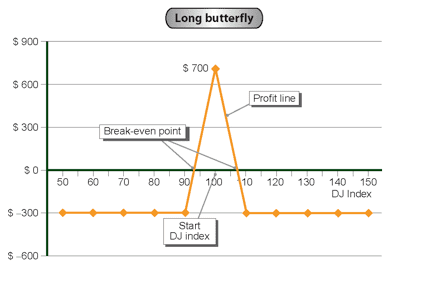
Strategy graph:

Strategy analysis:
Source of profit
We profit from the two Call options we have bought. When the index is less than 90, all the options expire without value and we are left with a profit of $300.
When the index is at 110 or higher, the loss is fully offset by the profit from the options we wrote.
Source of loss
Cost of building the strategy – $300. The loss from the options we have written is offset by the profit from the options we have bought.
Break-even point
This occurs when the index is at 107 points or at 93 points.
Auxiliary table for building the profit line
| DJ Index (Horizontal axis) |
(Fixed expenses)/ fixed income | Variable expenses (from writing options) |
Variable income (fron buying options) |
Total profit / (loss) (Vertical axis) 2+3+4 |
| 1 | 2 | 3 | 4 | 5 |
| 50 | ($300) | — | — | ($300) |
| 60 | ($300) | — | — | ($300) |
| 70 | ($300) | — | — | ($300) |
| 80 | ($300) | — | — | ($300) |
| 90 | ($300) | — | — | ($300) |
| 100 | ($300) | — | $1,000 | $700 |
| 110 | ($300) | ($2,000) | $2,000 | ($300) |
| 120 | ($300) | ($4,000) | $4,000 | ($300) |
| 130 | ($300) | ($6,000) | $6,000 | ($300) |
| 140 | ($300) | ($8,000) | $8,000 | ($300) |
| 150 | ($300) | ($10,000) | $10,000 | ($300) |


