| Market dATA | |
| DJ Index | 100 points |
| Prices | |
| Call 100 | $1,000 |
| Put 100 | $1,000 |
Strategy name:
Long “Strip”.
Recommended use of strategy
Expectation of volatile index but with a greater change of a decrease. Returning to the example of the elections, we forecast a higher probability of Y being expected President — driving down the index.
Strategy components
Buying 2 Put options of identical strike price.
Buying one Call option with the same strike price.
For example: Buying 2 Put 100 options and one Call 100 option.
Expenses / Income from building the strategy
Expenditure of $3,000
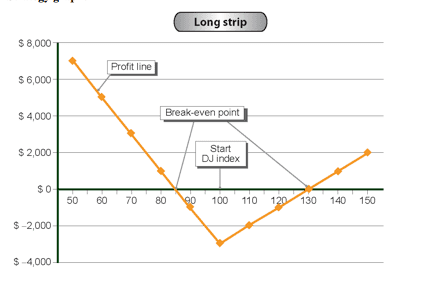
Strategy graph:

Auxiliary table for building the profit line
| DJ Index (Horizontal axis) |
(Fixed expenses)/ fixed income | Variable income (Call contribution) |
Variable income (Putl contribution) |
Total profit / (loss) (Vertical axis) 2+3+4 |
| 1 | 2 | 3 | 4 | 5 |
| 50 | ($3,000) | — | $10,000 | $7,000 |
| 60 | ($3,000) | — | $8,000 | $5,000 |
| 70 | ($3,000) | — | $6,000 | $3,000 |
| 80 | ($3,000) | — | $4,000 | $1,000 |
| 90 | ($3,000) | — | $4,000 | ($1,000) |
| 100 | ($3,000) | — | — | ($3,000) |
| 110 | ($3,000) | $1,000 | — | ($2,000) |
| 120 | ($3,000) | $2,000 | — | ($1,000) |
| 130 | ($3,000) | $3,000 | — | $0 |
| 140 | ($3,000) | $4,000 | — | $1,000 |
| 150 | ($3,000) | $5,000 | — | $2,000 |
Strategy analysis:
The strategy analysis is similar to that of the Long “Straddle”.
Source of Profit
We profit when there is a change in the index.
When the index goes up, we profit on the call option.
When the index goes down we profit on the 2 Put options.
The profit is greater if the index falls.
Source of loss
The loss derives from buying the strategy and decreases when a change occurs in the DJ Index and we start to make a profit.
Break-even point
When the profit from the Call option or from the 2 Put options covers the cost of purchase, $3,000. This occurs when the index is at 130 points or 85 points.

In this case we use a strategy similar to the “Strip”, known as a “Strap” (the next strategy).


