The profit line
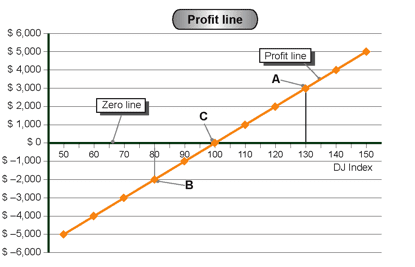
In explaining each strategy, we will use graphs, such as Graph no. 1, on which we drawn the profit line.
Each point on the profit line shows us our profit (or loss) at the exercise date of the options making up the strategy, if the DJ Index is the one below it (or above it).
For example, point A shows a profit of $3,000 from exercising the strategy, if the DJ Index stands at 130 points.
Point B shows a loss of $2,000, if the DJ Index stands at 80 points.
The profit line for all the strategies shows the range of the DJ Index where we will show a profit, and how much, and the DJ Index range where we will lose, and how much. When we are in the loss area, the profit line is below the $0 line.
The break-even point is the point where the profit equals zero. This point is marked C on the profit line.
Each point on the profit line is the result of a calculation carried out using the auxiliary table.
In the case of simple strategies, it is possible to plot the profit line quickly and easily, which we will demonstrate in Annex A at the end.
Graph 1

The horizontal axis of the graph shows the DJ Index at 10-point intervals. The vertical axis is in dollars.
Types of expenses and income involved in strategies
Both the expenses and the income from strategies can be of two types – fixed and variable:
Fixed expenses: These are expenses entailed in purchasing the strategy components.
For example, purchasing Call 300 or purchasing the DJ Index basket of shares.
Variable expenses: These expenses are caused by changes in the DJ index.
For example, if we write Call 300, our loss increases as the DJ Index rises above 300 points.
Fixed income: Income arising from writing options.
For example: Writing a Call 300 option.
Variable income: Income which is received as a result of changes in the DJ Index.
For example: If we buy Call 300, our profit increases as the DJ Index increases above 300 points.


