| Market dATA | |
| DJ Index | 100 points |
| Prices | |
| Call 120 | $500 |
| Put 80 | $500 |
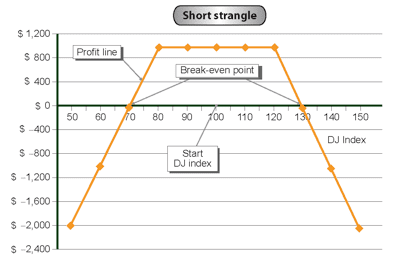
Short “Strangle”.
Recommended use of strategy
Expectation of relative stability of the DJ Index. Similar to the Short Straddle strategy.
Strategy components
- Writing a Short Call option outside-the-money (at a strike price which is higher than the DJ Index).
- Writing a Short Put option outside-the-money (at a strike price which is lower than the DJ Index).
For example: Selling a Short Call 120 option at a price of $500, and selling a Short Put 80 option at a price of $500.
Expenses / Income from building the strategy
Income of $1,000.
Strategy graph:

Auxiliary table for building the profit line
|
DJ Index (Horizontal axis) |
(Fixed expense) / fixed income |
Variable expenses (Call contribution) |
Variable expenses (Put contribution) |
Total profit / (loss) (Vertical axis) 2+3+4 |
|
|
|
|
|
|
|
50 |
$1,000 |
– |
($3,000) |
($2,000) |
|
60 |
$1,000 |
– |
($2,000) |
($1,000) |
|
70 |
$1,000 |
– |
($1,000) |
$0 |
|
80 |
$1,000 |
– |
– |
$1,000 |
|
90 |
$1,000 |
– |
– |
$1,000 |
|
100 |
$1,000 |
– |
– |
$1,000 |
|
110 |
$1,000 |
– |
– |
$1,000 |
|
120 |
$1,000 |
– |
– |
$1,000 |
|
130 |
$1,000 |
($1,000) |
– |
$0 |
|
140 |
$1,000 |
($2,000) |
– |
($1,000) |
|
150 |
$1,000 |
($3,000) |
– |
($2,000) |
Strategy analysis:
Source of Loss
We lose on a sharp change in the DJ Index. When the index goes up we lose on the Short Call we have written. When the index goes down we lose on the Short Put we have written.
Source of profit
Income from building the strategy. The profit is maximized when the DJ Index moves in narrow range, and is limited to the amount received from building the strategy.
Break-even point
When the loss from the Call option or from the Put option equals the income from writing the options totaling $1,000. This occurs when the index is at 130 points or 70 points.


