For simple strategies, there is a short method for plotting the profit lines.
In order to simplify the explanation, for each of the strategies, we will plot the profit line in two stages:
Stage 1 – Assuming that we have no costs or income from building the strategy. (The strategy is given free of charge).
Stage 2 – Taking into account the expenditure or income from building the strategy.
|
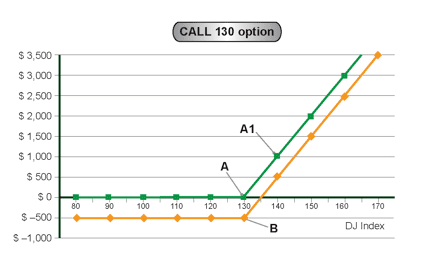
Long Call
For example, Call 130
Stage 1: We will start plotting the profit line at point A (Index 130, Price $0).
Moving rightwards from point A, the profit line rises at an angle (straight line) which intersects with point A1 (Index 140, Profit $1,000).
To the left of point A the profit line lies on the horizontal axis.
We will call this profit line “A”.
Stage 2: We will start plotting the profit line at point B (Index 130, Loss $500). Moving rightwards from point B, the profit line rises at an angle parallel to profit line “A”. To the left of point B the profit line lies on the horizontal axis.
We will call this profit line “B”.
Thus, profit line “B” is parallel to profit line “A”, at a distance of $500 beneath it.

Strategy no. 2
|
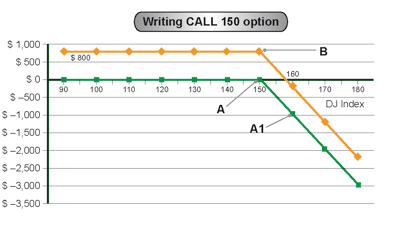
Short Call
For example, Call 150.
Stage 1: The profit line starts at point A (Index 150, Price $0).
Moving rightwards from point A, the profit line declines, intersecting with point A1 (Index 160, Loss $1,000).
To the left of point A the profit line lies on the horizontal axis.
Stage 2: The profit line starts at point B (Index 150, Profit $800). Moving rightwards from point B, the profit line declines, parallel to profit line “A”.
To the left of point B the profit line lies on the horizontal axis.

Strategy no. 3
|
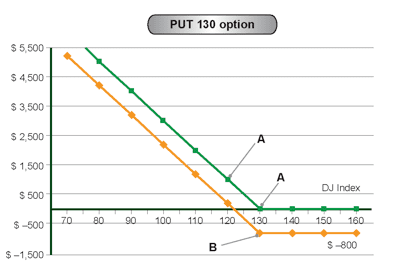
Long Put
For example, Put 130.
Stage 1: The profit line starts at point A (Index 130, Price $0).
Moving leftwards from point A, the profit line rises, intersecting with point A1 (Index 120, Profit $1,000).
To the right of point A the profit line lies on the horizontal axis.
Stage 2: The profit line starts at point B (Index 130, Loss $800). Moving leftwards from point B, the profit line rises, parallel to profit line “A”. To the right of point B the profit line lies on the horizontal axis.

Strategy no. 4
|
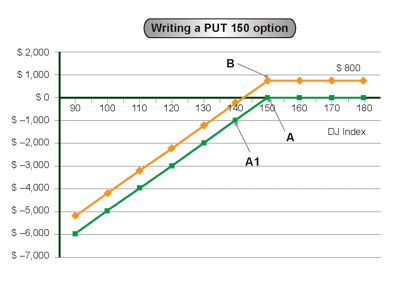
Short Put
For example, Put 150
Stage 1: The profit line starts at point A (Index 150, Price $0).
Moving leftwards from point A, the profit line declines, intersecting with point A1 (Index 140, Loss $1,000).
To the right of point A the profit line lies on the horizontal axis.
Stage 2: The profit line starts at point B (Index 150, Price $800+). Moving leftwards from point B, the profit line declines, parallel to profit line “A”.
To the right of point B the profit line lies on the horizontal axis.


