| Market dATA | |
| DJ Index | 100 points |
| Prices | |
| Call 100 | $1,000 |
Strategy name:
Short Call option
Recommended use of strategy
Expectation of decline in DJ Index
Strategy components
Writing a Call option
Example: Writing Call 100 at a price of $1,000
Expenses / Income from building the strategy (at start date)
Income of $1,000
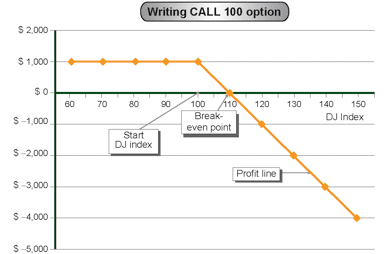
Strategy graph:

Auxiliary table for building the profit line
| DJ Index (Horizontal axis) |
(Fixed expenses)/ fixed income | Variable expenses | Variable income (Call contribution) | Total profit / (loss) (Vertical axis) 2+3+4 |
| 1 | 2 | 3 | 4 | 5 |
| 60 | $1,000 | — | — | $1,000 |
| 70 | $1,000 | — | — | $1,000 |
| 80 | $1,000 | — | — | $1,000 |
| 90 | $1,000 | — | — | $1,000 |
| 100 | $1,000 | — | — | $1,000 |
| 110 | $1,000 | ($1,000) | — | $0 |
| 120 | $1,000 | ($2,000) | — | ($1,000) |
| 130 | $1,000 | ($3,000) | — | ($2,000) |
| 140 | $1,000 | ($4,000) | — | ($3,000) |
| 150 | $1,000 | ($5,000) | — | ($4,000) |
Strategy analysis:
Source of loss
The loss arising from writing the Call option. As the DJ Index increases, so does the loss increase.
Source of profit
The profit from building the strategy (writing the option) – $1,000.
Break-even point
The point where the losses from the option equals the income from writing it. This occurs at 110 points.


