Treatment of the Number of Employees’ Children
In the section concerning the number of children, we encounter quantitative data for the first time. The frequency table, however, is constructed in the same way, as follows:
In order to prevent confusion, we should keep in mind that the number in the frequency column represents how many times the number in the value column appears:
Also, keep in mind that reading in the opposite order will provide inaccurate results, so be careful.
The graphic representation of the frequency distribution of the number of children will use a stick diagram.
|
Value |
Frequency |
Relative Frequency (rounded off) |
|
0 |
5 |
17% |
|
1 |
6 |
20% |
|
2 |
10 |
33% |
|
3 |
7 |
23% |
|
4 |
2 |
7% |
|
Total |
30 |
100% |
Note:
In the tables we have seen up until now, the words appeared in the value column, and the numbers in the frequency column. Since the “Number of children” variable receives numerical values (0,1,2,3,4), the numbers will appear in both the value and the frequency columns.
In order to prevent confusion, we should keep in mind that the number in the frequency column represents how many times the number in the value column appears:
- There are 5 cases of employees with 0 children.
- There are 6 cases of employees with 1 child.
- There are 10 cases of employees with 2 children.
- There are 7 cases of employees with 3 children.
- There are 2 cases of employees with 4 children.
Also, keep in mind that reading in the opposite order will provide inaccurate results, so Be careful.
The graphic representation of the frequency distribution of the number of children will use a stick diagram, as follows:
Diagram
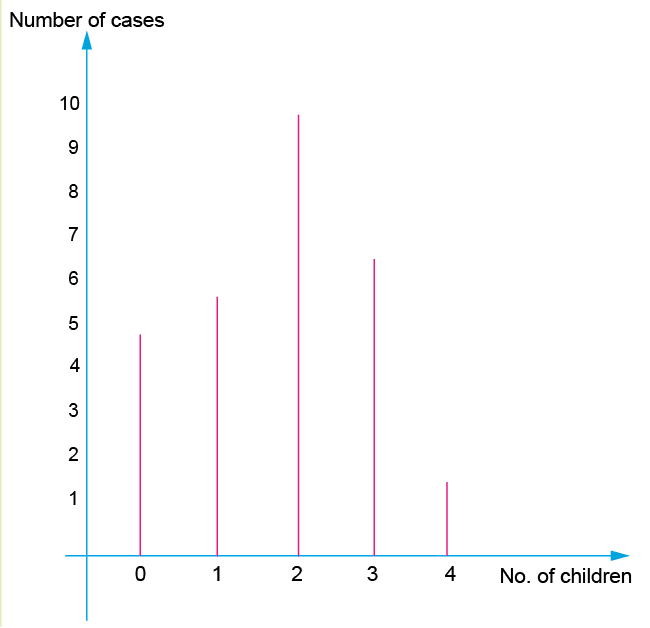
Note: Here, too, it is possible to present the diagram so that the relative frequency appears on the vertical axis, instead of the frequency.


