The difference between the highest value received in the sample and the lowest value reflects the range of the sample. We will again consider the three samples shown above:
Sample A: 7, 7, 7, 7, 7, 7, 7
Sample B: 10, 10, 7, 7, 7, 4, 4
Sample C: 8, 7, 7, 7, 7, 7, 6
We remind you that the centrality measures of these samples are identical. What is the range of each sample? In Sample A, the highest value is 7 and the lowest value is 7, so the range is 0 (7 – 7 = 0).
This is an indication that the sample is centralized, and in effect lacks any dispersal at all. The range of Sample B is 6, because the highest value is 10 and the lowest value is 4 (10 – 4 = 6). In Sample C, the highest value is 8 and the lowest value is 6, so the range is 2 (8 – 6 = 2).
Sample B is therefore more widely dispersed than Sample C, and both of them are more widely dispersed than Sample A.
Is the Range a Sufficient Measure of Dispersal?
Consider the following samples:
Sample A: 9, 8, 7, 6, 5, 4, 3, 2, 1
Sample B: 9, 5, 5, 5, 5, 5, 5, 5, 1
The range of both samples is 8 since the highest value in both samples is 9, and the lowest is 1 (9 – 1 = 8).
At the same time, it can readily be seen that Sample A is widely dispersed between 1 and 9, while in Sample B, the values 1 and 9 are actually unusual; the other values in the sample are 5, which indicates that the sample is concentrated.
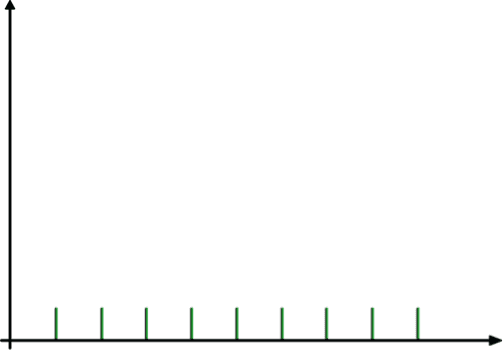
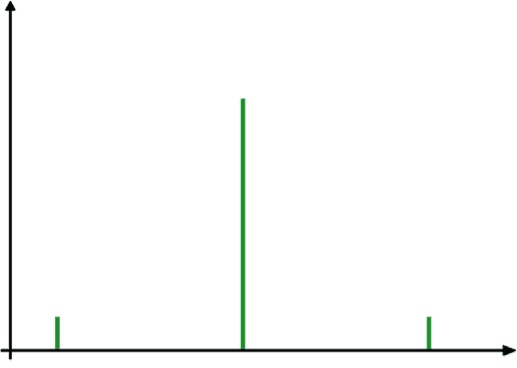
We will examine these samples with a stick diagram.
The stick diagrams for the samples are as follows:
SAMPLE A SAMPLE B


It therefore follows that the range is not a sufficient measure of dispersal, and that another measure is needed. Statisticians have developed an amazingly simple scientific “tool” for examining the degree of dispersal. This “tool” is called the standard deviation, which is denoted by the Greek letter σ (i.e., a small sigma).


