An average represents a single number obtained as the result of a calculation that serves as the midpoint value of a group of data with similar characteristics, i.e., that are measured by using the same units. The group of data can be the marks of children in 1st grade in school, the heights of 10 year-old children, etc. A more exact definition of the term “average” will be presented later in the chapter.
We will present three methods of calculating an average in an example involving the marks of 10 4th grade pupils on an arithmetic test.
First Method: Add up the Marks, and then Divide by the total Number of Pupils
The following table lists the pupils’ marks on the test.
| Order of Pupils (alphabetized by names) | Mark (in points) |
| Pupil no. 1 | 90 points |
| Pupil no. 2 | 80 points |
| Pupil no. 3 | 70 point |
| Pupil no. 4 | 90 points |
| Pupil no. 5 | 80 points |
| Pupil no. 6 | 70 points |
| Pupil no. 7 | 80 points |
| Pupil no. 8 | 70 points |
| Pupil no. 9 | 70 points |
| Pupil no. 10 | 70 points |
| Total marks | 770 points |
| Average | 77 points = 770 points/10 pupils |
In order to calculate the average, we add up all of the pupils’ marks. The result is 770 points. We divide this by the number of pupils, which results in 77 points. Thus, 77 points is the average mark.
A More Exact Definition of the Average
We will refer to the total of the group’s marks (770 points) as “the original total of the group’s marks”.
Had all of the marks been identical, then the average would equal the original total divided by the number of students. This means that 77 (the average) x 10 = 770 points.
Second Method: Calculating the Contribution of Each Pupil to the Average
As we will presently see, every pupil contributes some number of points toward the average. Two factors affect the size of the contribution.
I. The student’s Marks – the higher the score, then the greater the contribution to the average.
II. The student’s relative proportion in the class, which we will now explain.
The expression relative proportion indicates the pupil’s proportion in relation to the total number of pupils in the class.
In a class of 10 pupils, each of the pupils constitutes 1/10 of the class, or 10%.
In a class of 2 pupils, each pupil constitutes 1/2 of the class, or 50%.
In a class of 1 pupil, the pupil represents the entire class, or 100%.
The larger the pupil’s relative proportion, then the greater is their contribution to the average. Instead of the expression relative proportion, the term “weight” is sometimes used. From now on, we will use the latter term in most cases.
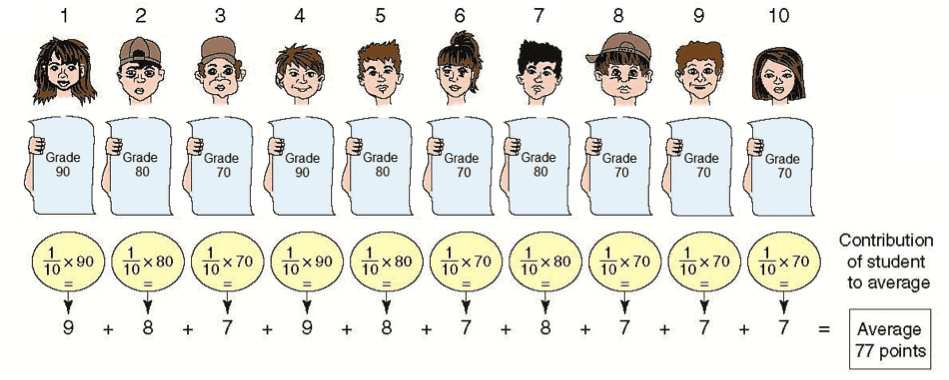
The following illustration displays the contribution of each pupil to the average.
The illustration is divided into two parts:

- Part 1 shows each of the 10 pupils with the marks received below.
- Part 2 shows the contribution of each pupil to the average, and how it was calculated.
It can be seen in the illustration that pupil no. 1 contributes 9 points to the average. The contribution is obtained by multiplying the grades (90 points) by the student’s weight in the class (10%). Pupil no. 2 contributes 8 points to the average with grades of 80 points, and a class weight of 10%, and so on through the tenth pupil.
Third Method – Using Groups of Pupils with the Same grade
This method is the most popular and the simplest.
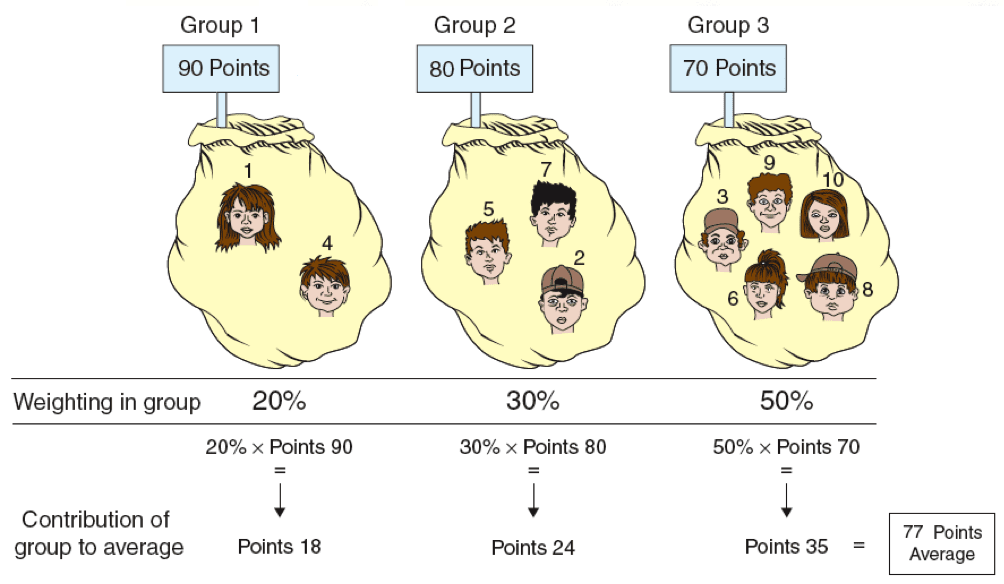
For purposes of the calculation, we will group the pupils of the class according to the marks they received.

I. The Group’s grades – the higher the student’s grade, then the greater their contribution to the group’s average.
II. The Group’s Weight – the group’s weight reflects the total weight of all pupils in the group.
In our example, each pupil’s weight is 10% (i.e., so the weight of 3 pupils is 30%, and the weight of 5 pupils is 50%).
In the illustration, it can be seen that:
Group 1 contributes 18 points to the average.
Group 2 contributes 24 points to the average.
Group 3 contributes 35 points to the average.
The three groups contribute a total of 77 points, which reflects the average.
Organizing the Data in a Table
We will present the data in a table:
| Numbering the Groups | The Marks | Number of Items in Each Group) | The Group’s Weight | The Group’s Contribution to the Average |
| (1) | (2) | (3) | (4) | (5) = (2) X (4) |
| Group 1 | 90 pts. | 2 | 20% | 18 pts. |
| Group 2 | 80 pts. | 3 | 30% | 24 pts. |
| Group 3 | 70 pts. | 5 | 50% | 35 pts. |
| Total | 10 | 100% | 77 pts. (the average) |
Note that the above table is essentially a frequency table. Column 2 represents the value of the variable, column 3 the frequency, and column 4 the relative frequency.
It follows that the concepts: relative proportion, relative frequency, and weight are synonyms.


