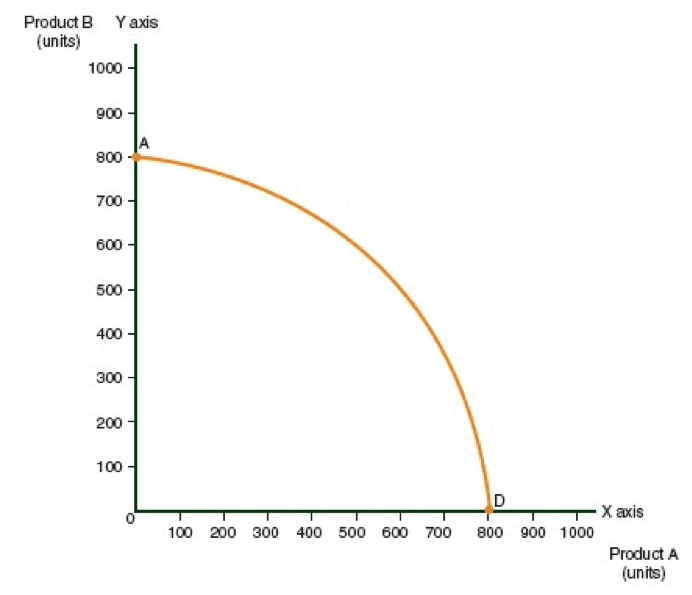
The PPC is usually a concave curve that starts at one axis and ends at the other, as illustrated. We will call this curve AD, using the letters at each end of the curve. Point A intersects the Y-axis, and Point D intersects the X-axis. Each axis measures the quantity of a specific item produced.
The PPC always contains only two products, under the assumption that these are the only goods that the country produces. One product lies on the X-axis, and the other lies on the Y-axis.
Diagram 2.1
The production possibilities curve

Example of the Production Possibilities Curve
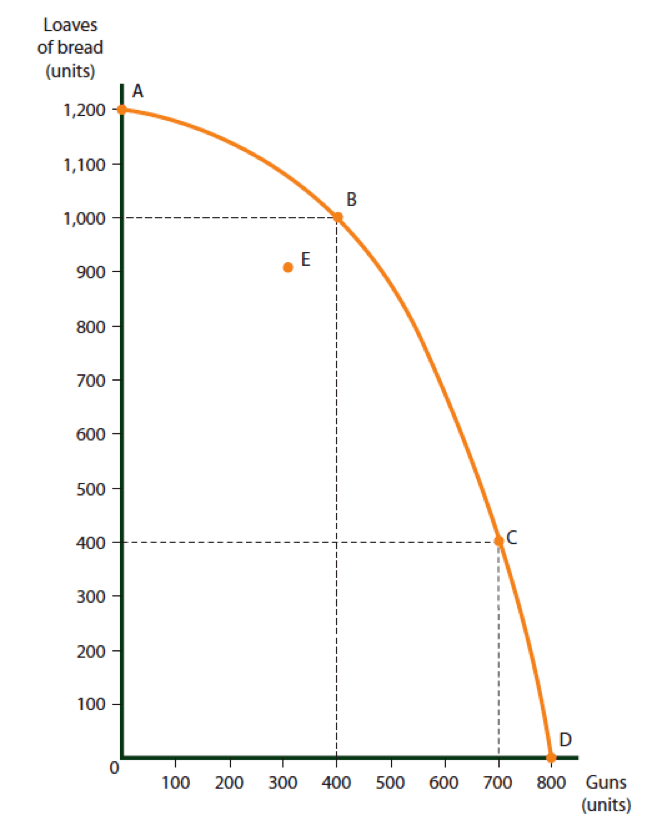
In order to better understand the Production Possibilities Curve, consider the simple example shown in the diagram. Assume that Country A produces only guns and bread:
- The X axis indicates the quantity of guns.
- The Y axis indicates the quatity of bread.
Diagram 2.2
The Production Possibilities curve for Country A

Reading the Production Possibility Curve
Starting at point B.
- Point B shows that the country can produce 400 guns and 1,000 loaves of bread.
- Point C shows that the country can produce 700 guns and 400 loaves of bread.
- Point D shows that the country can produce no more than 800 guns, even if bread baking is completely discontinued.
- Point A shows that the country can bake a maximum of 1,200 loaves of bread, even if gun production is completely discontinued.
Production Possibility Curve – Conclusion
The Production Possibilities Curve demonstrates the phenomenon of scarcity: Manufacturing more of one product detracts from the production of another item. In order to increase production of one item, we must transfer resources from another sector. Every point on the PPC represents a combination of the two products that a country can manufacture using its available resources.
The production possibilities curve is also called the production possibility frontier, because any point beyond the curve represents an impossible situation. The country’s economy cannot support production beyond the quantities represented by the curve. In other words, according to the graph Country A cannot simultaneously produce 401 loaves of bread and 700 guns, nor can it bake 400 loaves of bread and 701 guns simultaneously.


