The following are some causes of declined manufacturing capability:
-
Fewer workers, as a result of emigration to other countries, for example.
-
Natural disasters, such as earthquakes or floods.
-
Less investment in machines, tools, or buildings. Spending money on these items is called capital investment, or capital expenditures (CAPEX). Without capital investments, a country’s manufacturing capability will decline.

Declining Manufacturing Capability Resulting in New PPC
If the manufacturing capability of a country declines for any reason (for example, if factories are destroyed by fire), then it will produce less of each product. A new PPC will be drawn beneath the original border. Curve A2D2 in the following diagram illustrates this case.
The explanation:
-
Point D2 on the new curve shows that Country A can only produce 1,000 loaves of bread, instead of 1,200 previously.Point A2 shows that if Country A chooses to make guns and no bread, it can produce only 600 guns, compared to 800 previously.Point C2 indicates that the country can make at most 800 loaves of bread and 300 guns, compared with 1,000 loaves of bread and 400 guns previously.
With fewer resources available, the country can produce less bread and fewer guns. A2D2, the new PPC (production possibilities curve), shows that fewer goods are produced at every point as compared with AD, which was the original curve. Point C2 indicates that less bread and fewer guns are produced than at Point C.
Decline in Manufacturing One Product Results in the New PPC Drawn
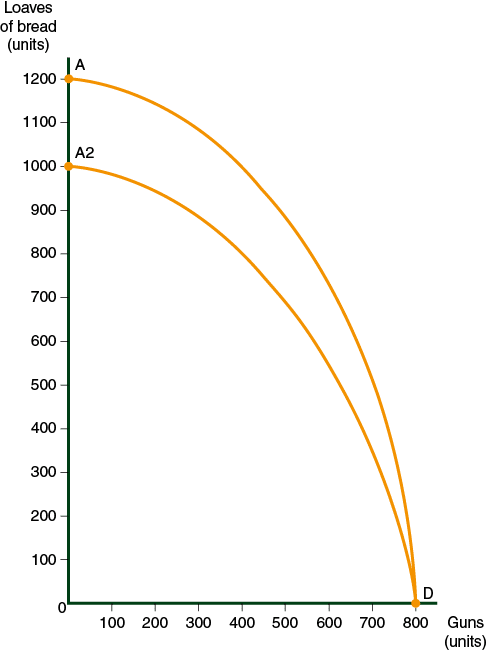
The decline in manufacturing capability may affect only one of the products that Country A produces. For example, if one of the bakeries burns down, then a new PPC which is shown in the following diagram, is generated. All points on the new curve are less than those in the previous curve, with the exception of Point D.
Diagram 2.7


