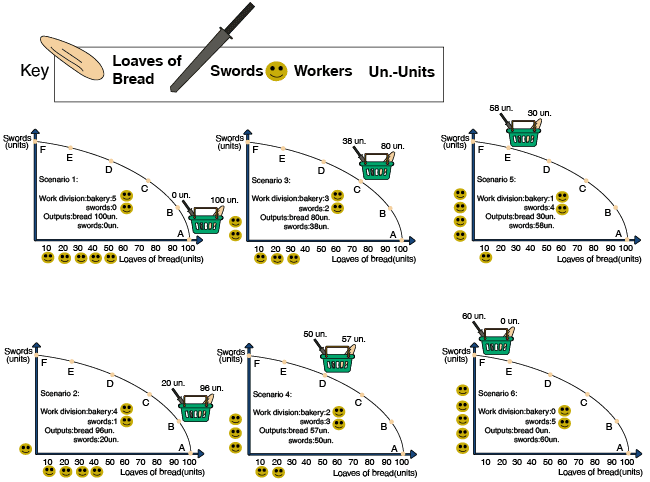
Displaying Economic Situation in the Country With the Scenarios in Illustrations
The purpose of the scenarios in the illustration is to display the economic picture prevailing in Country A when the output in Sector A decreases by a given amount due to an employee’s transfer from Sector A to Sector B (the new quantity is stated in the scenario). At the same time, output in Sector B rises (to the quantity stated in the scenario). A similar sequence of events occurs when employees are transferred from Section B to Section A. Looking at the scenarios twice is recommended: Once in increasing order (from 1 to 6) and once in decreasing order (from 6 to 1).
Note the distinction between a possible point located inside the area under the transformation curve and the point located on the curve itself.
A point inside the area means that the production factors (the principal production factors are employees and machinery) in the country are being underutilized. The point represents the existing outputs, which are lower than the country’s existing potential.
A point on the curve means that the country is fully utilizing its production capacity. The transformation curve is therefore also referred to as the limit of the country’s production possibilities. The country cannot produce beyond these production limits. In other words, it cannot be at a point outside the curve.
When there is no underutilization of production factors, then the country can be at any point of its choice on the transformation curve. The transition from one point to another is accomplished by shifting production factors (employees and machinery) from one sector to another. The next chapter shows that although a country can produce only limited quantities, local consumers can enjoy a quantity of goods beyond their local PPC by trading with other countries. For example, trade allows Country A to buy 100 swords, although the PPC for Country A restricts production to only 60 swords.
The next chapter discusses trade in more detail. Instead of using a production possibilities curve to represent a country’s manufacturing options, the Trade and transformation curve is introduced. This curve demonstrates that a country enjoys more goods by trading with other countries than by trying to produce everything by itself.