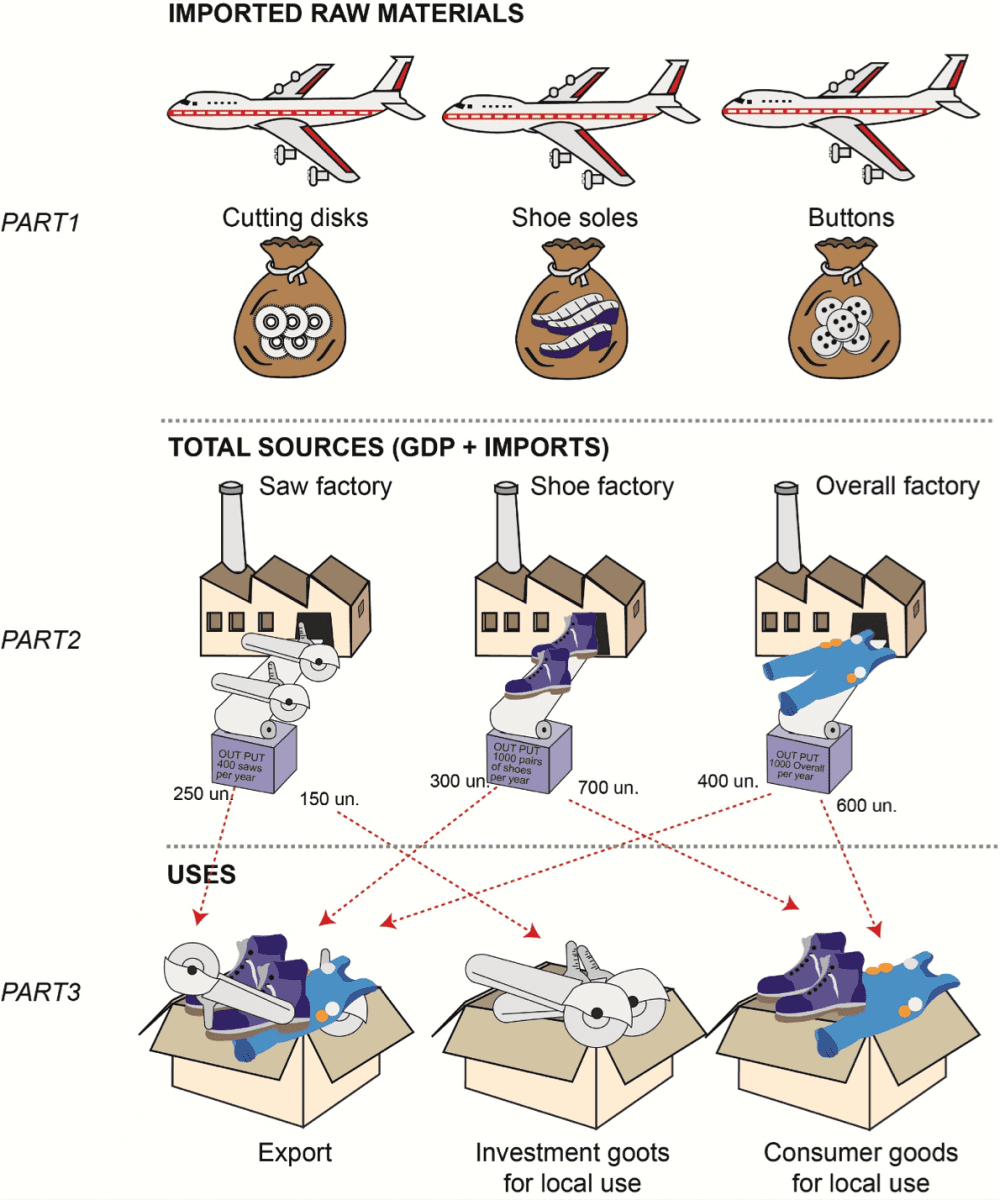
The following illustration shows the complete picture of how a national economy works during a given period, which is usually one year. The illustration is divided into three parts.
Part 1 – Imported raw materials:
Part 1 presents imported raw materials separately from all other data.
Part 2 – total sources (GDP and imports):
Part 2 presents all products that are available to a country during the year i.e., the goods manufactured in the country, plus the imported raw materials that were used in production. The imported raw materials are colored gray.
Part 3 – Uses:
Part 3 shows how the country uses its resources. The illustration shows how resources have been directed to three objectives:
-
Local consumption.
-
Local investment and capital goods. These capital goods are directed for use in the factories as shown in Part II.
-
Exports.
The Connection Between Sources and Uses:
Economic activity is presumed to originate with uses (Part III), meaning that people decide which products they would like to have, and industry then supplies them with those items. In practice, however, there is interaction between consumers who wish to purchase goods and the ability and desire of firm owners to make those products.


