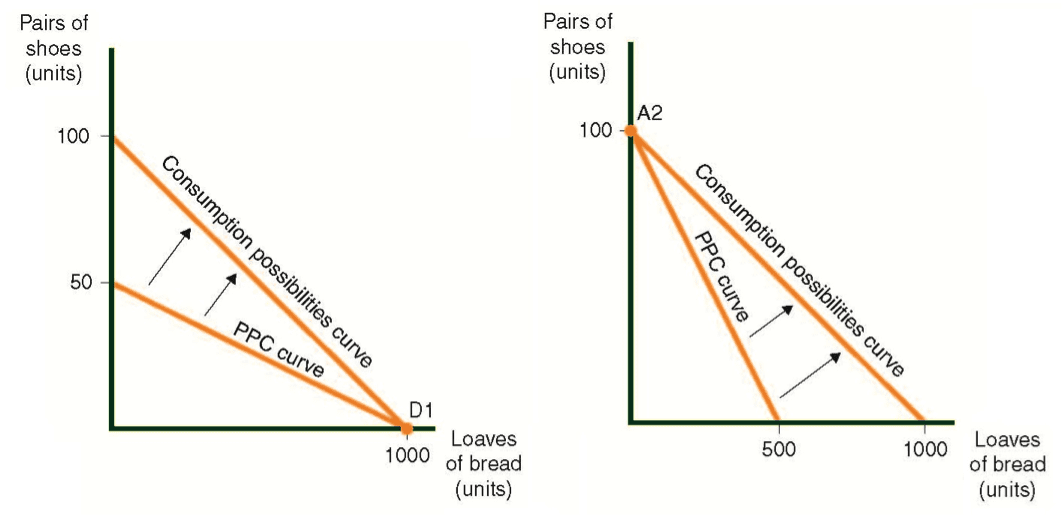
Trade increases the amount of goods that are available for each country to consume. The PPCs does not indicate a country’s ability to consume goods. A new curve, the consumption possibility curve, is needed to show the consumption options. The consumption possibility curve is superimposed over the PPC.
The following diagram depicts the consumption possibility curve of countries C and D resulting from trade between them.
Diagram 3.3
Consumption Possibilities Curve of Countries C and D, Superimposed Over the PPC
Country C Country D
10 residents, all bakers 10 residents, all shoemakers

Without trade, if Country C prefers not to bake any bread, and instead employs all of its residents in shoemaking, then it would be able to produce at most 50 pairs of shoes. As a result of trade, even if it still bakes no bread, it can obtain 100 pairs of shoes, which is an increase of 50 pairs.
How can this be accomplished?
It can send the bread to country D in exchange for 100 pairs of shoes.
In this example, where only two countries exist, it is not certain that the residents of Country D will be willing to go completely without shoes. In reality, there are many trading countries, each of which will be willing to trade a few of its shoes for bread.
In practice:
-
Country C will end up at point A1. It will make 1,000 loaves of bread, including a portion for local consumption. The remainder will be exchanged for shoes from Country D.
-
Country D will end up at point D2. It will produce 100 pairs of shoes, including a portion for local consumption. The remainder will be exchanged for bread from Country C.


