GDP = Aggregate Demand (Only in a Closed Economy)
The equality is due to the simple fact that the country produces only as much as its residents plan to consume. In practice, GDP automatically and gradually adapts itself at the national level to aggregate demand (i.e., GDP becomes equal to aggregate demand). The country will not produce 1,000 loaves of bread when its residents will only eat 800 loaves. On the other hand, a situation is possible where the residents would like to eat 1,200 loaves of bread, although the country can produce a maximum of 1,000 loaves. In this situation, there is a shortage of bread and the residents will have to be satisfied with whatever is available, i.e., they will eat only 1,000 loaves of bread. The primary factor that will persuade the residents to reduce their consumption is the rise in the price of bread. As a result of the shortage of bread, prices will increase to the level where demand falls to 1,000 loaves of bread. It is important to bear in mind that the equality between GDP and aggregate demand remains regardless of whether the country fully exploits its capacity (and reaches maximum GDP (YF), or whether it only partially exploits its capacity.
“Aggregate Supply” and “Aggregate Demand” instead of “Resources
In the previous chapter concerning federal and/or national accounting procedures, we used the terms “resources” and “uses”.
Table 11.1
Resources and aggregate demand report
|
Resources |
Uses |
|
GDP |
Private consumption |
|
|
Public consumption |
|
|
Investments |
In this chapter, we will use the terms “aggregate supply” (or GDP) in place of “resources”, and “aggregate demand” instead of “uses”.
An ideal economic situation
When the relationship between GDP and aggregate demand is fulfilled and GDP is at a maximum (YF), then the situation is ideal since the country is fully exploiting its factors of production.
A neglected situation
In any country, when the equation is fulfilled and GDP is not yet at a maximum, then the situation is “neglected” since the country is not fully exploiting its production factors.
Example:
In country B, the maximum GDP is $1,000.
Table 11.2 illustrates country B when the economic situation is ideal.
Table 11.2
An ideal situation in country B
|
Resources (Aggregate Supply) |
Uses (Aggregate Demand) |
|
| GDP = YF $1,000 | Private consumption |
$700 |
| Public consumption |
$200 |
|
| Investments |
$100 |
|
| Total |
$1,000 |
|
Table 11.3 illustrates country B when the situation is neglected.
Table 11.3
A neglected situation in country B
|
Resources (Aggregate Supply) |
Uses (Aggregate Demand) |
|
| GDP = YF $600 | Private consumption |
$400 |
| Public consumption |
$150 |
|
| Investments |
$50 |
|
| Total |
$600 |
|
A graphic representation of the Relationship between GDP and its uses
The curve in the diagram expresses graphically the relationship between GDP and its uses.
Elements of the curve:
Axes
The X axis represents GDP, which is symbolized by Y.
The Y axis represents aggregate demand, which is symbolized by E.
Diagonal
A diagonal with a 45° slope extending from the 0 coordinate. Every point on the 45° diagonal slope has the same values for both Y and E.
For example, in the diagram, point A on the diagonal represents $600 in GDP (on the X axis), and an aggregate demand of $600 (on the Y axis).
Diagram 11.4
The relationship between GDP and its uses
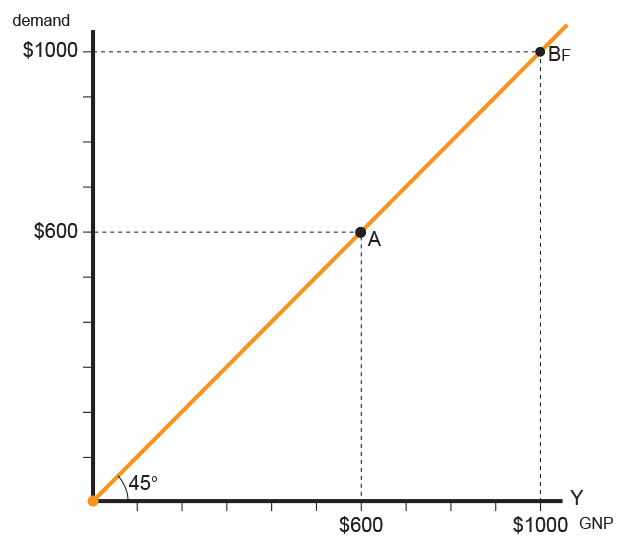
Location of a country on the diagonal line
Every country is represented by a point on the diagonal line. For example, consider country B, which has already been presented in this chapter:
-
In the diagram, when the country is at point B, it produces GDP totaling $1,000, which is the maximum GDP (the letter F accompanies the number). It is also country B’s maximum aggregate demand.
-
When the country is at point A, it is in a neglected situation. Its GDP is only $600, which represents only 60% of the maximum GDP, and its aggregate demand is of equivalent size.
The diagram constitutes the skeleton of curves used by Dr. Keynes.
We now return to Dr. Keynes’ theory.


