There are cases when the word expectation replaces the word average. The most common instance is when the weight (in percentages) of each group is obtained on the basis of an estimate, instead of by taking an exact count of the number of individuals in the group. Then we can calculate their proportion of the target population.
Actually, the size of the target population is also irrelevant in these cases when calculating the average.
Does this sound unclear?
If so, your confusion may be legitimate. We hope, however, that beginning with the second in the sequence of three examples (which are very similar to the examples we have already solved), the confusion will vanish.
Example 1 – Bill’s Barbershop
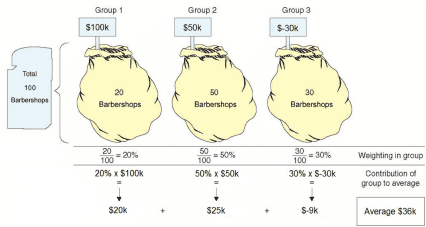
Bill has been offered the chance to open a barbershop. Since he is a careful person, he has decided to thoroughly consider the chances of success. For this purpose, he has met with 100 of his friends who own barbershops, and obtained from them information about the profits of their barbershops. The following picture emerges from the data he has collected:
20 barbershops earn $100k a year.
50 barbershops earn $50k a year.
30 barbershops lose $30k a year.
As usual, for the sake of simplicity, we have restricted the variety of sample data to three sets. The data show that most of the barbershops were profitable. Bill found that encouraging, but he wanted to work more professionally, and calculated the average profit per barbershop. The result he obtained is $36k.
Organizing the Data – an Exercise
At this stage, we will carefully organize the data in each example , and also present an illustration. After a few more examples, however, you will find that is easy for you to arrange the data in a table, and you can also make the calculations quickly.
The target population is 100 barbershops.
The sample data are $100k, $50k, and $-30k.
Division into Groups
Illustration 3.4
Inserting the Data in a Table
Table 3.8
| No. of the Group | Characteristics of the Group | Sample Data of the Group (annual profit) | Number of Individuals in Each Group | Weight of the Group | Contribution of the Group to the Average |
| 1 | 2 | 3 | 4 | 5 | 3 = 6 X 5 |
| Group 1 | None | $100k | 20 barbershops | 20% | $20k |
| Group 2 | None | $50k | 50 barbershops | 50% | $25k |
| Group 3 | None | $–30k | 30 barbershops | 30% | $-9k |
| Total | 100 barbershops | 100% | $36 average |
Carlos’s Barbershop
Carlos, a recent immigrant from Argentina and a barber employed in the same barbershop also considers opening his own barbershop. Carlos has no friends who own barbershops, but he is an intelligent person and he has decided to consult an economic advisor.
The advisor considered the matter, and reported his conclusions to Carlos, as follows:
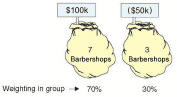
There is a 70% chance that he will earn $100k per year.
There is a 30% chance that he will lose $50k per year.
The Meaning of the Advisor’s Conclusions:
The meaning of the advisor’s conclusions is simple.
According to his advice, if Carlos chose to open a large number of barbershops today (1,000, for example), then 70% of them would earn 100k and 30% of them would lose 30k.
For the sake of simplicity, we have limited the sample data presented by the advisor to two possibilities: A 100k profit and a 50k loss. It is impossible to know whether or not the advisor’s analysis is correct, but that is his evaluation, and we will assume from now on that Carlos uses it.
Calculating the Average Profit according to the Advisor’s Data:
In this example, the term expectation will replace the term average. We will use two methods to make the calculation:
The method we are familiar with assuming that Carlos opens 10 barbershops, including barbershops that earn a profit and barbershops that lose money, exactly according to the advisor’s prediction.
The short method.
Calculation according to the Known Method
Organizing the data:
The target population is 10 barbershops.
The sample data – there are two possibilities: $100k and $50k.
In other words, the expected profit per barbershop is $55k.
Presenting the Data in an Illustration:
Illustration 3.5
Inserting the data in a table:
Table 3.9
| No. of the Group | Characteristics of the Group | Observation Data of the Group (profits of the barbershops) | Number of Individuals in Each Group | Weight of the Group | Contribution of the Group to the Average |
| 1 | 2 | 3 | 4 | 5 | 3 = 6 X 5 |
| Group 1 | None | $100k | 7 | 70% | $70k |
| Group 2 | None | $(50k) | 3 | 30% | $(15k) |
| Total | 100% | $55k expectation |
In other words, the expected profit per barbershop is $55k.
The Short Method
Background:
In his conclusions, the advisor has in effect already ordered the samples into groups and has also given the groups weights. All we have to do is to multiply the sample data by their respective weights.
Terms with Identical Meanings:
- Average and expectation -Average and expectation are two terms with the same meaning. The course “Fundamentals of Statistics” explains at length when each of the two terms should and should not be used. Here, we will only hint that the term expectation should be used when the calculation is based on probabilities, and the term average should be used when the calculation is based on relative weight.
- Relative weight, probabilities and chance – Relative weight, probability, and chance are three terms with the same meaning. We will not discuss this point extensively in this book. Everyone can use whichever term they want according to their own intuition (which is usually correct).
Explanation:
According to what the advisor said, we assume that there are only two possible sample data.
- $100k (profit).
- $-50k (loss).
Two groups are organized according to these two observations. The weight of each group reflects the chance cited by the advisor, since the meaning of the word chance suggests that regardless of how many barbershops are opened, 70% of them will be in the $100k group and 30% in the $-50k group. We therefore fill in the table without having to calculate column 5 (which the advisor has determined).
Table 3.10
| No. of the Group | Characteristics of the Group | Observation Data of the Group (profits of the barbershops) | Number of Individuals in Each Group | Weight of the Group | Contribution of the Group to the Average |
| 1 | 2 | 3 | 4 | 5 | 3 = 6 X 5 |
| Group 1 | None | $100k | Irrelevant | 70% | $70k |
| Group 2 | None | $-50k | Irrelevant | 30% | $-15k |
| Total | 100% | $55k expectation |
John is also Considering Opening a Barbershop
Not surprisingly, many people are attracted to haircutting.
One of them is John, who works in a garage. John has no friends who are barbers, and no money for advisors. He asks us for help. We suggested that he think along the usual lines by imagining that he is able to open many barbershops, and that there are only four possible annual profit results:
- $100k.
- $70k.
- $20k.
- $-50k.
We instructed him to try to estimate how these imaginary barbershops were distributed (divided) among the four possible results, or, in simpler words, what percentage of the barbershops will earn $100k, $70k, or $20k, and what percentage will lose $50k.
We told him to put his estimates in column 5 of the following table and use them to calculate column 6 and the expectation. John understood us, and calculated the expected profit.
Table 3.11
| No. of the Group | Characteristics of the Group | Observation Data of the Group (profits of the barbershops) | Number of Individuals in Each Group | Weight of the Group | Contribution of the Group to the Average |
| 1 | 2 | 3 | 4 | 5 | 3 = 6 X 5 |
| Group 1 | None | $100k | —– | 20% | $20k |
| Group 2 | None | $70k | —– | 20% | $14k |
| Group 3 | None | $20k | —– | 50% | $10k |
| Group 4 | None | $(50k) | —– | 10% | $(5k) |
| Total | 100 | 100% | $39k expectation |
Based on John’s estimates, the expected profit is $39k.


