
How to use technical indicators on Crypto Hopper

Technical indicators are mathematical calculations based on an asset’s past data. They provide insights into potential price directions.
Different types of technical indicators
There are 4 different types of technical indicators:
- Trend indicators
- Momentum indicators
- Volatility indicators
- Volume indicators
When using technical indicators on a chart, you can select multiple indicators.
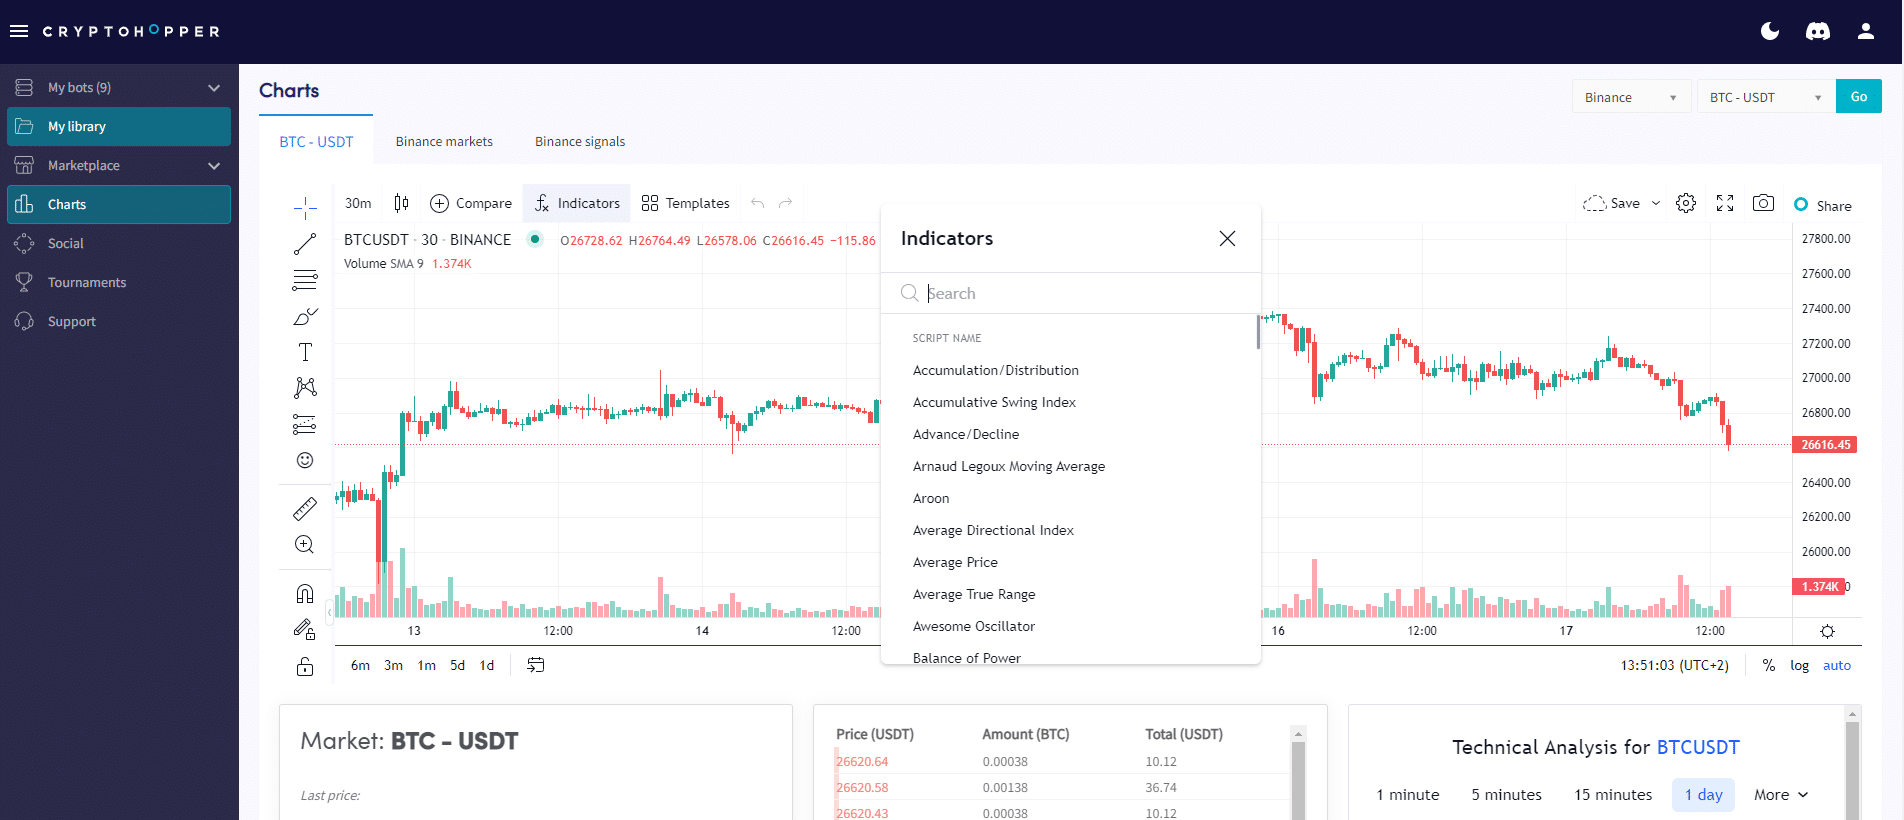
Trend indicators
These indicators align prices of uneven candles into one solid line. The idea is to identify and track trends to predict how long they will last and where they may reverse. This way, you can base your trading decisions on that. Most trend indicators are moving averages. These are calculations that average prices for “X” previous periods to identify a trend line. The philosophy behind trend lines is that prices can change between different candles, but if you calculate an average, you can see whether the total of all the candles indicates an uptrend (price increase) or a downtrend (price decrease). With this information, you can understand when the asset will return to its previous value, or when it is in a narrow range (moving sideways) because most of these indicators lose money when the price stabilizes.
The most representative indicators for identifying trends are moving averages. There are different types of moving averages, and each of them has different specifications. The most common ones have been added here. For example, Simple Moving Averages (SMA) , Exponential Moving Averages (EMA) , Double Moving Averages (DEMA) , KAMA , Mesa Adaptive Moving Average (MESA) , Triangular Moving Average (TMA) , TEMA , Parabolic SAR , and WMA . For an explanation of different technical indicators, click here.
Momentum indicators
Summarize the speed and strength of price movement. They compare the current closing price to the price from a certain period in the past. Momentum indicator levels range from 100 to 0, or around the zero line, depending on the indicator. For example, if the current level is 64 and the previous level was 60, this suggests that the price is moving upwards.
Momentum indicators by themselves don’t provide much information about future price movements. They mainly tell us whether the price is trending up or down and whether it is considered a 225/2082 or a stalled slide based on previous price ranges.
The most common momentum indicators have been added here. For example, Stochastic , RSI , StochRSI , Ultimate Oscillator , Williams %R , Chaikin A/D Oscillator , CCI , Money Flow Index (MFI) , PPO , and Rate of Change (ROC) . For an explanation of different technical indicators, click here.
Volatility indicators
Measures the volatility of the price. Indicates when the market is more volatile and has more volume. Traders love volatility. It moves the price and creates trading opportunities, and is usually accompanied by higher volume. Markets with low volatility are considered boring and unprofitable, as well as less liquid.
The most common volatility indicators have been added here. For example, Bollinger Bands , Average True Range (ATR) , and Average Directional Movement (ADX) . For an explanation of different technical indicators, click here.
Volume indicators
Indicates the number of contracts traded for a particular asset during a period. These indicators will help measure the strength of the trend and its direction. Traders like volume because it creates trading opportunities. On the other hand, they try to avoid periods of low volume because the price may move in a narrow range, which can lead to trading with low profits or losses.
The most common indicator of volume is market volume. Market volume measures the number of contracts traded at a given time. This indicator (which is not really an indicator because it does not involve calculations) is one of the most commonly used for market analysis. It provides excellent insight into when and where volume occurs in the market.
The most common volume indicators have been added here. For example, Balance Volume (OBV) , Chaikin A/D Oscillator , and Money Flow Index (MFI) . For an explanation of different technical indicators, click here.