How to build a strategy with the Strategy Builder in Crypto Hopper

This tutorial shows an example of a strategy created using the Strategy Builder.
Strategy example
Here is an example of how to build a strategy with the Strategy Builder. Important: This is just an example. Always conduct your own research. In this example, an uptrend in the market will be identified using MESA on the daily chart. This is what MESA looks like on the chart:
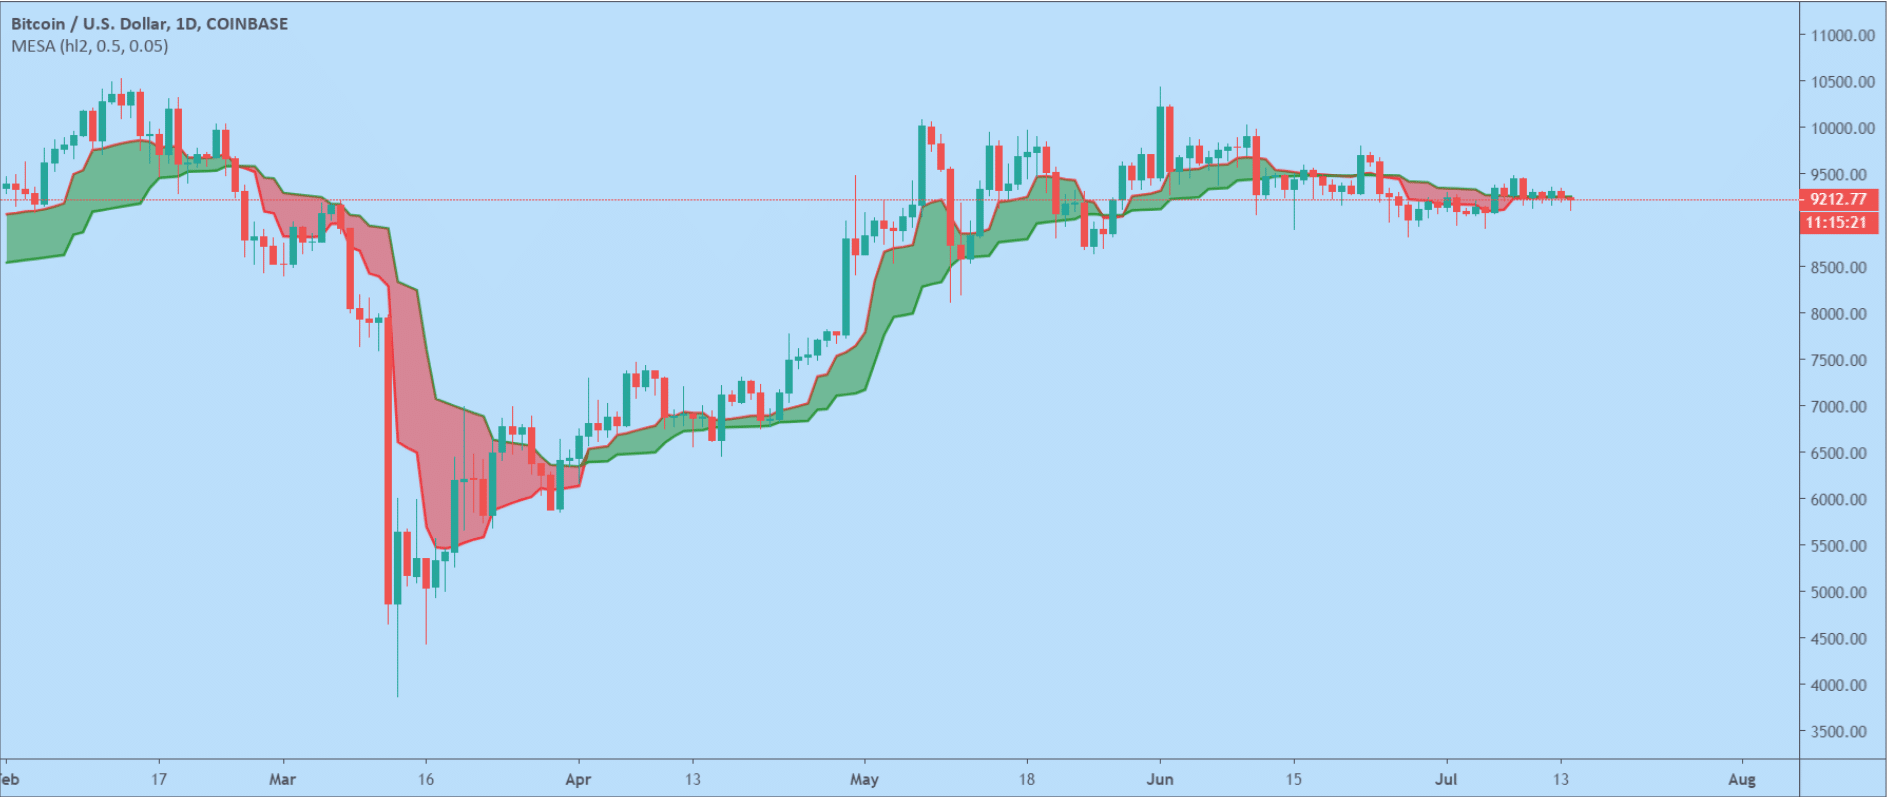
The MESA will signal an uptrend as long as the cloud is green. For more information on indicators, click here . This is what it looks like when using Cryptohopper:
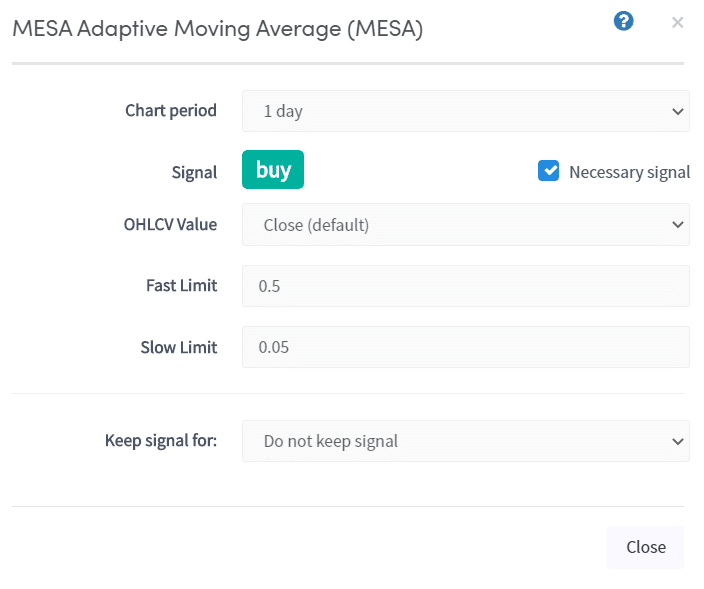
Graph period
Select the time frame you want to use. This is the candle size that the indicator works on. In our example we used a one-day candle size. You can choose from one day to one minute.
Signal
Choose Buy or Sell. In our example, we chose Buy.
OHLCV value
Select the value. This is a unique setting for the MESA indicator. In our example, we selected Close (default).
Fast border
Fill in the border. In our example, we kept the default of 0.5.
Slow border
Fill in the boundary. In our example, we kept the default of 0.05.
Save signal for
Select a specific number of candles. You can also select “Do not keep signal”. When there are several indicators and two of them should give a signal to buy. Not all indicators will signal to buy at the same time. The signal will remain for the number of candles you selected. The duration of the signal displayed depends on the size of the candle and the number of candles. In our example, this is not necessary for the MESA.
Necessary signal
Check the box if you want the indicator to signal a buy every time you enter a position. This option is useful when you have a strategy of 6 indicators, but only 4 indicators need to give a buy signal at the same time to enter a trade. If you want one of the four indicators to be active at all times, check this option.
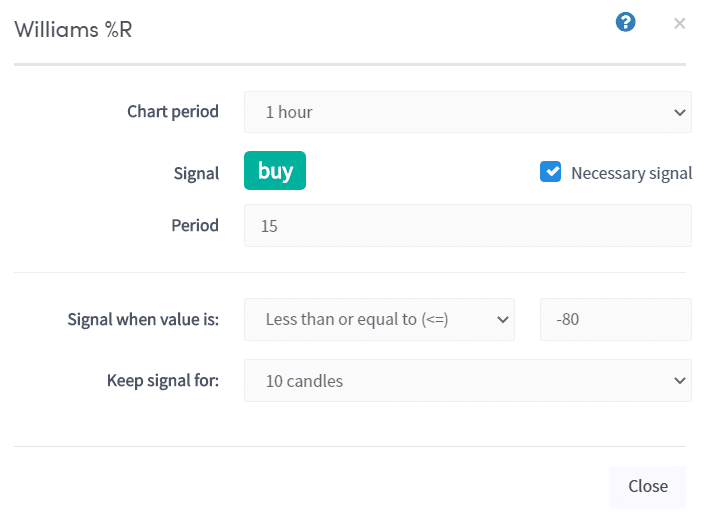
For our example, we will identify a downtrend in the market using William’s %R on the hourly chart. This is what the William’s %R looks like on the chart:
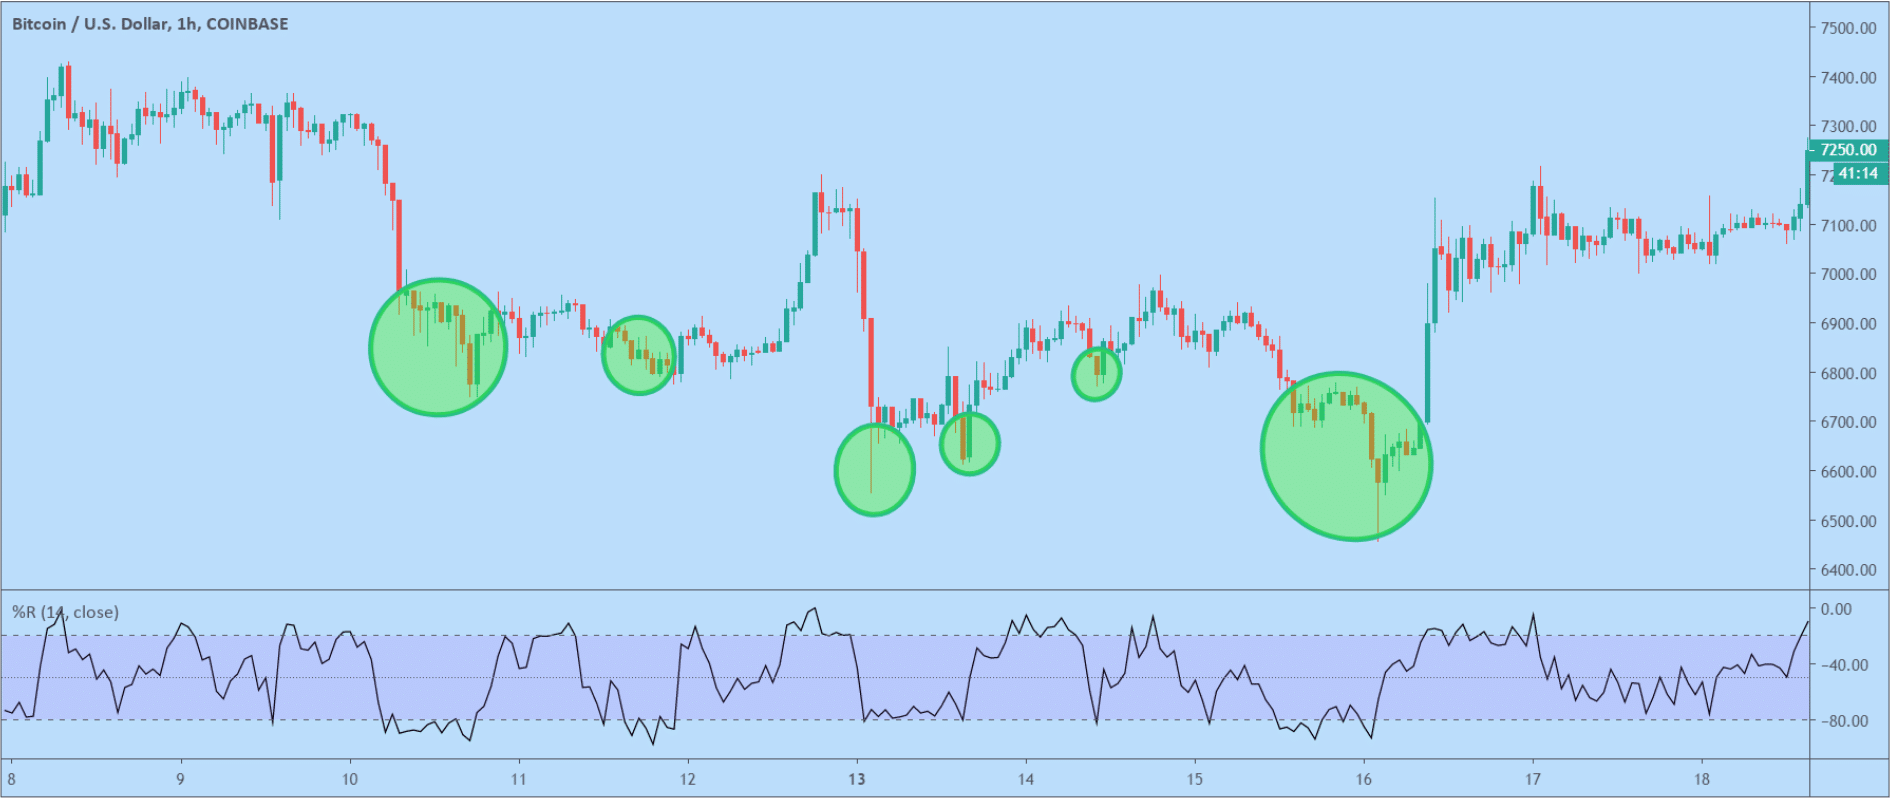
The indicator will detect a bottom whenever the black line drops below the lower band at -80. The green circles mark the bottom on the chart. William’s %R can find good buying points in a rising market. However, it has some significant drawbacks. When the market breaks down, the indicator will signal a buy without stopping. As a result, you may enter a position only to have the market continue to fall much further. Therefore, this indicator should be combined with another indicator. This is how it looks when using Cryptohopper:
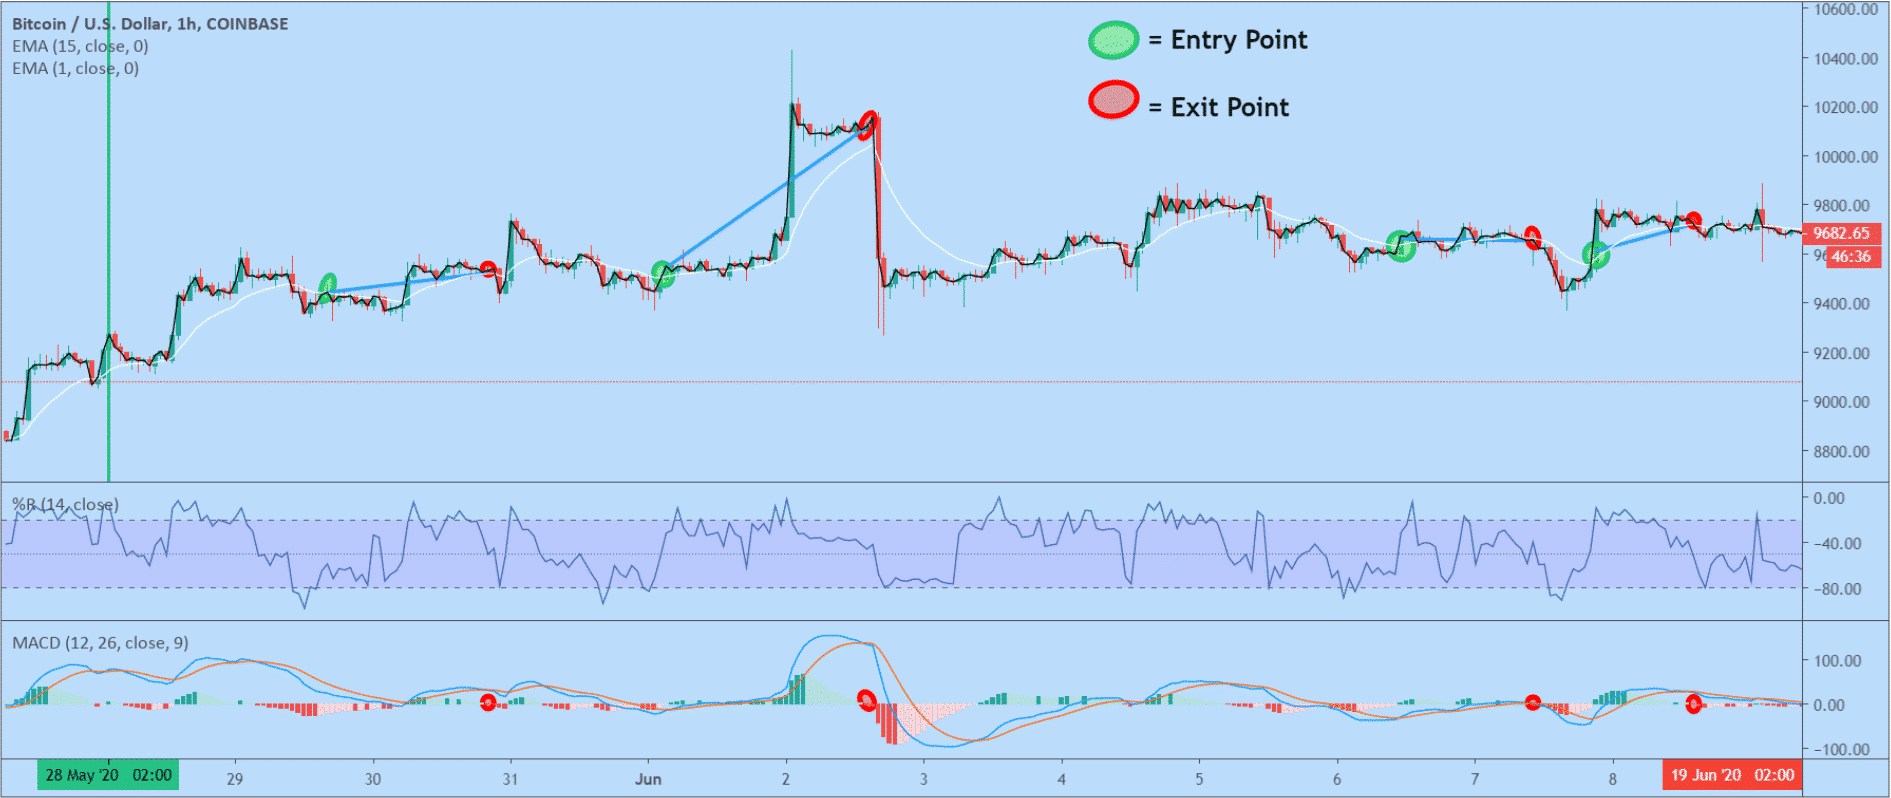
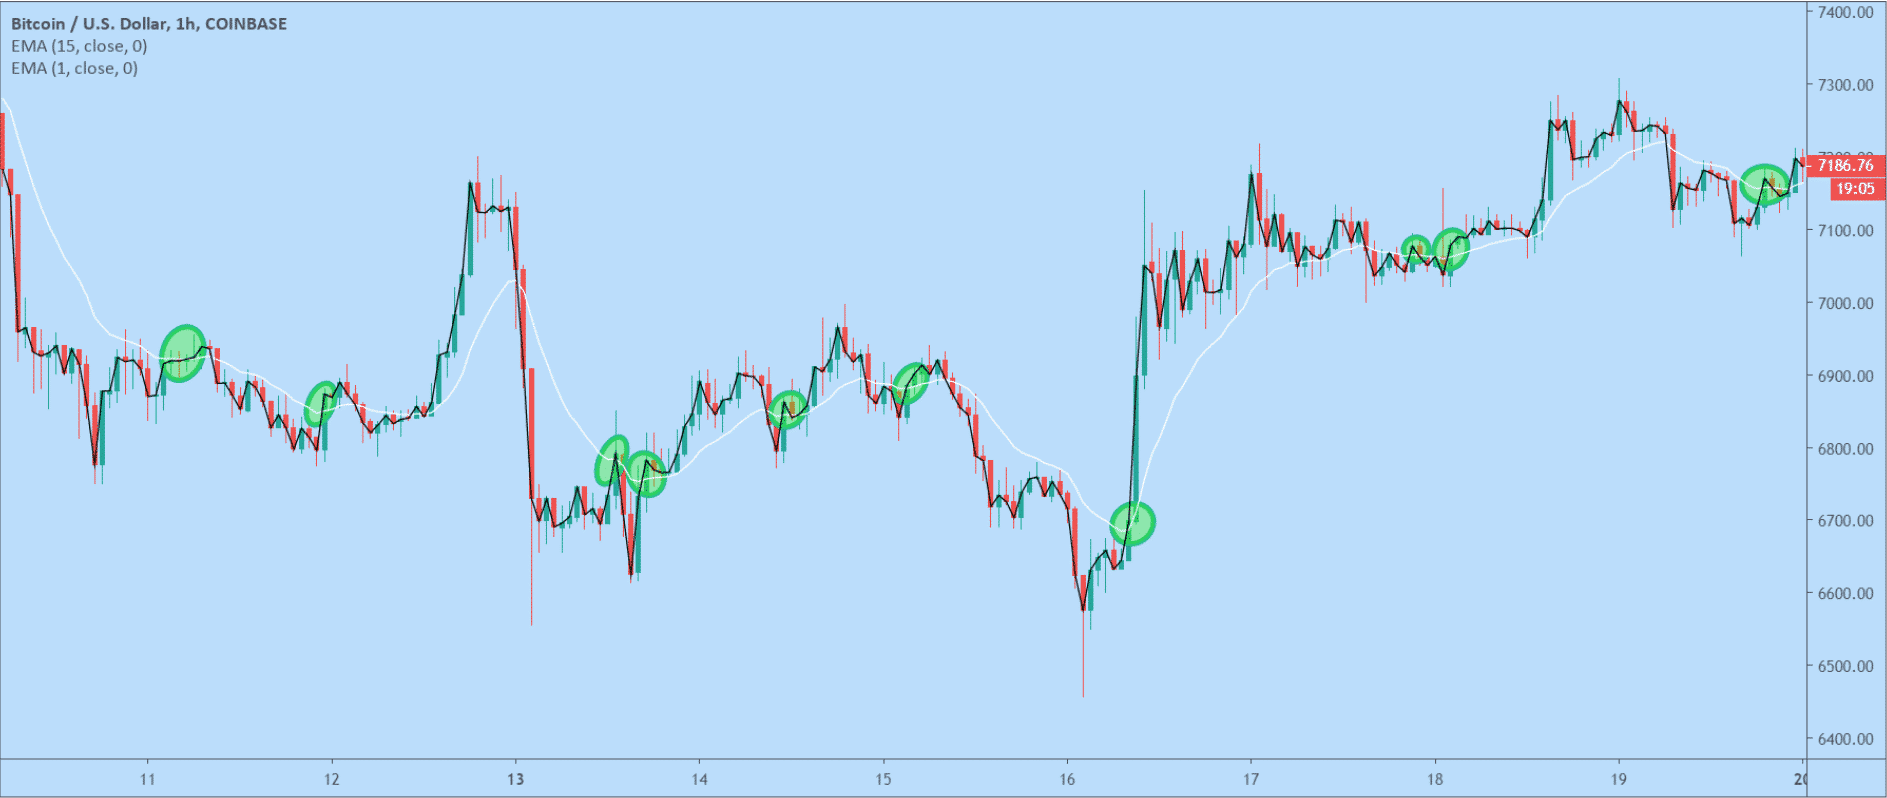
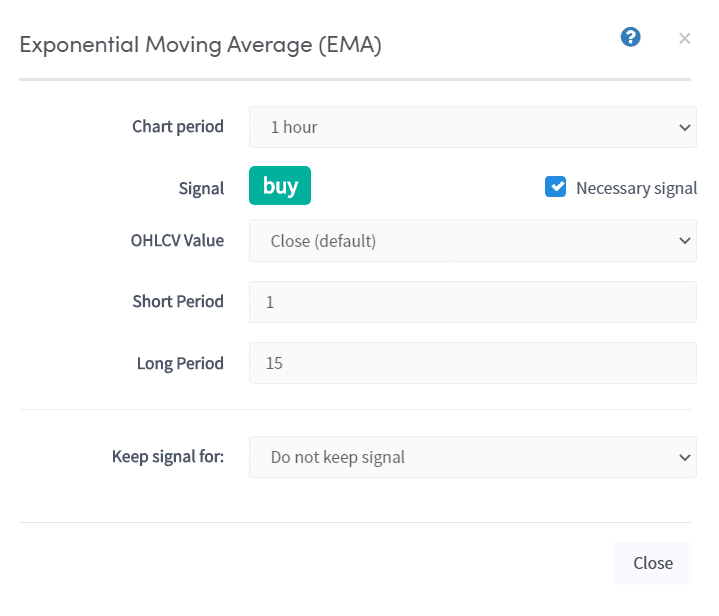
Now we will add an indicator that can complement the William’s %R indicator to confirm a buy signal. The 1st and 15th EMA crossing can work well in identifying when the trend is up again. This indicator produces “buy signals” whenever the fast EMA crosses the slow EMA, as shown on the chart.
This is what it looks like when using Cryptohopper:
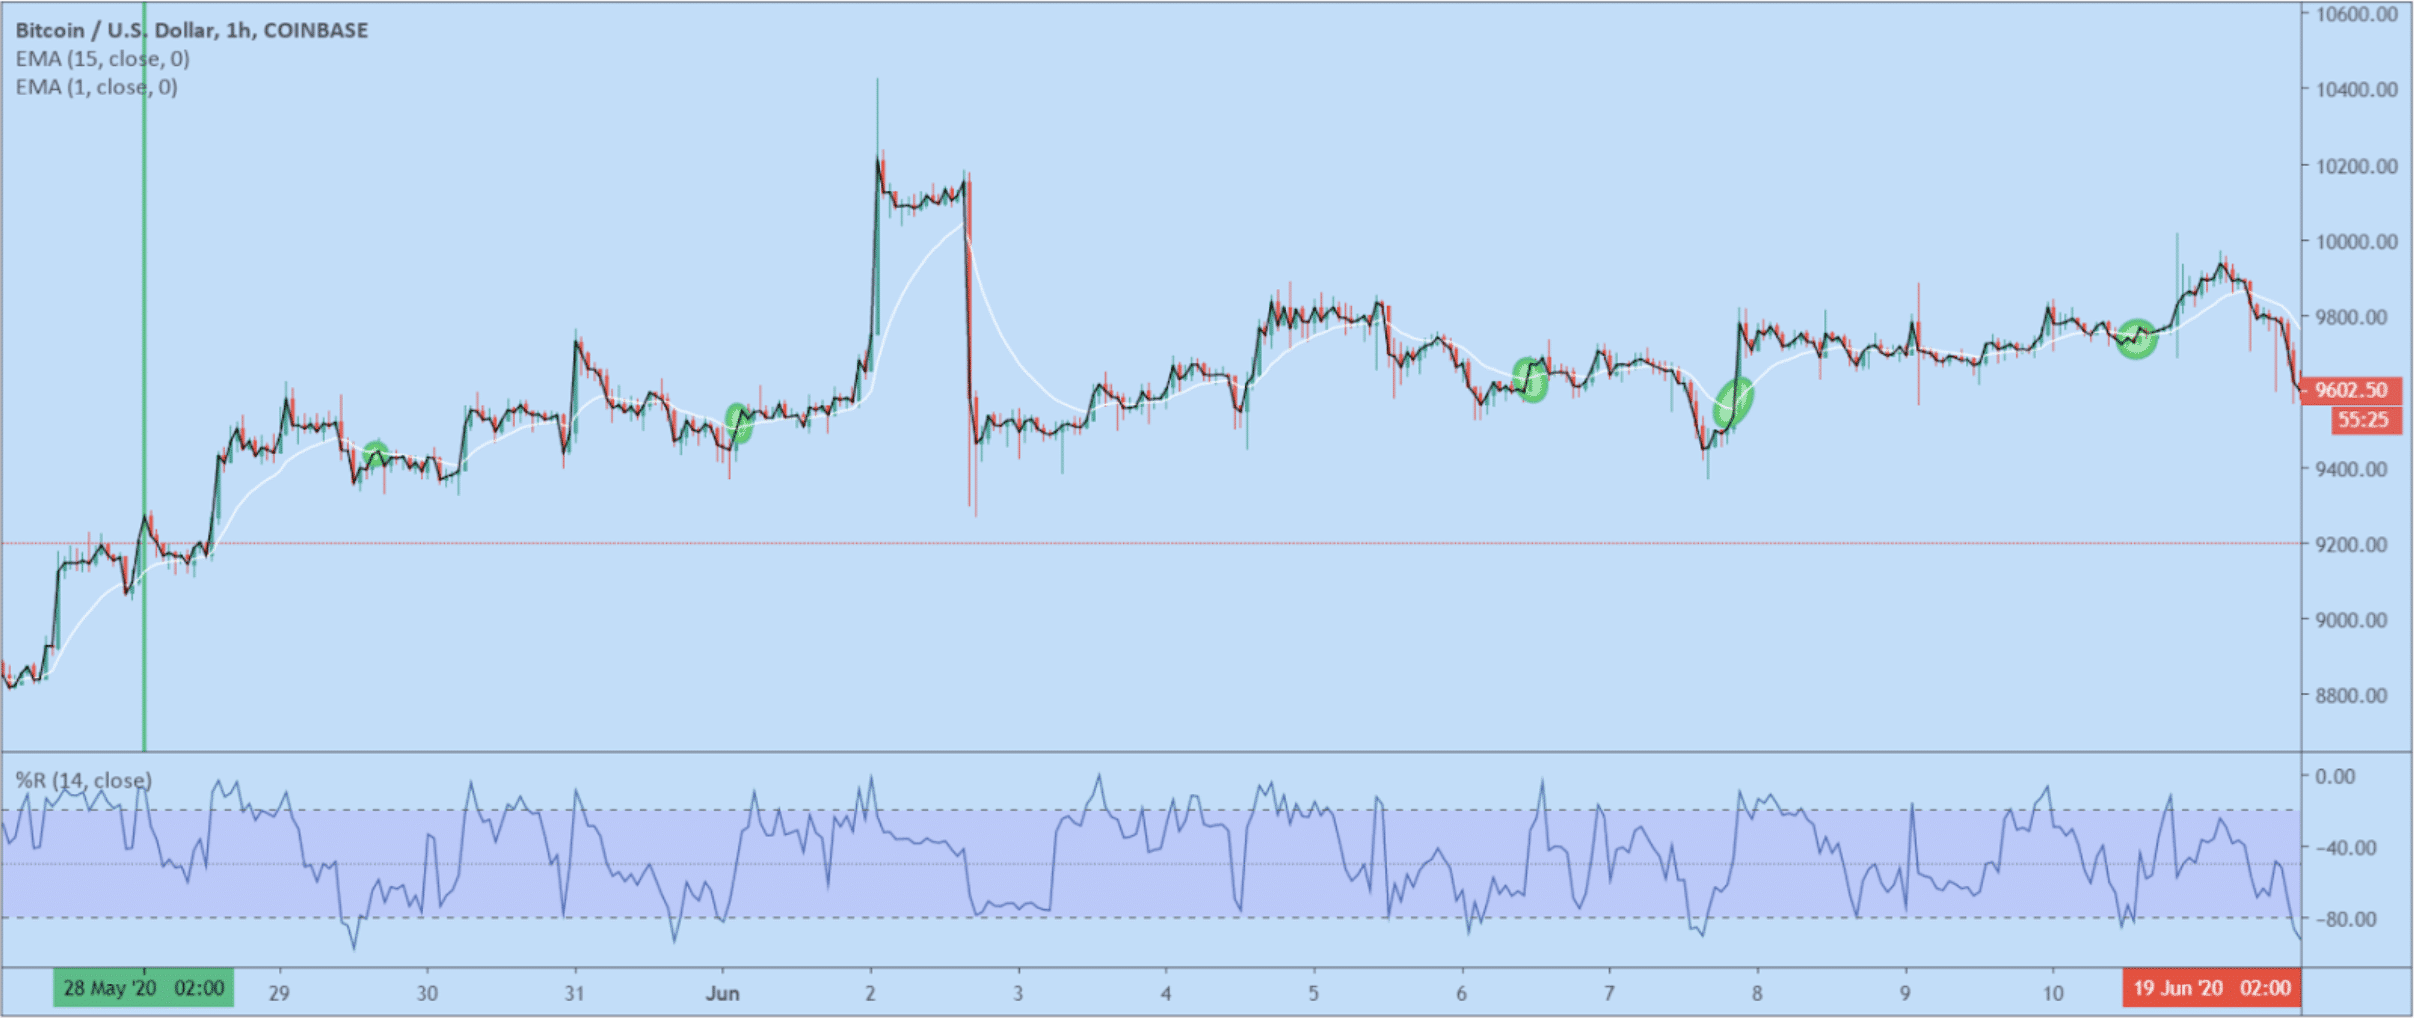
We chose to keep the William’s %R signal for 10 candles. It is very rare for the Williams %R to be in a sell position while the EMA crossing indicates a bullish signal. The vertical green line on the left indicates the moment when the MESA turned bullish on the daily chart.
We set the minimum of “buy” signals to 3 out of 3. This means that all indicators are necessary for the bot to make a trade.

This feature is useful if there are multiple indicators. Not all of them are essential to the strategy, and some of them can be substitutes. For example, if you consider MACD as a substitute for EMA and not essential to the strategy. You will need 3 out of 4 minimum buy signals. You still have MESA and William’s %R as needed, while EMA is no longer essential. In the end, you need MESA and William’s %R to signal a buy signal, and then you need either MACD or EMA to include a buy signal for your bot to open a position.
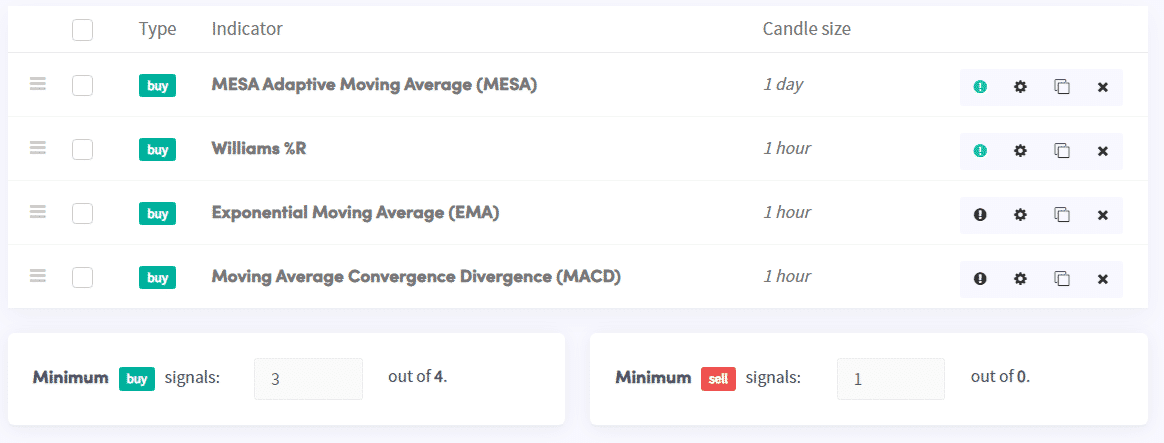
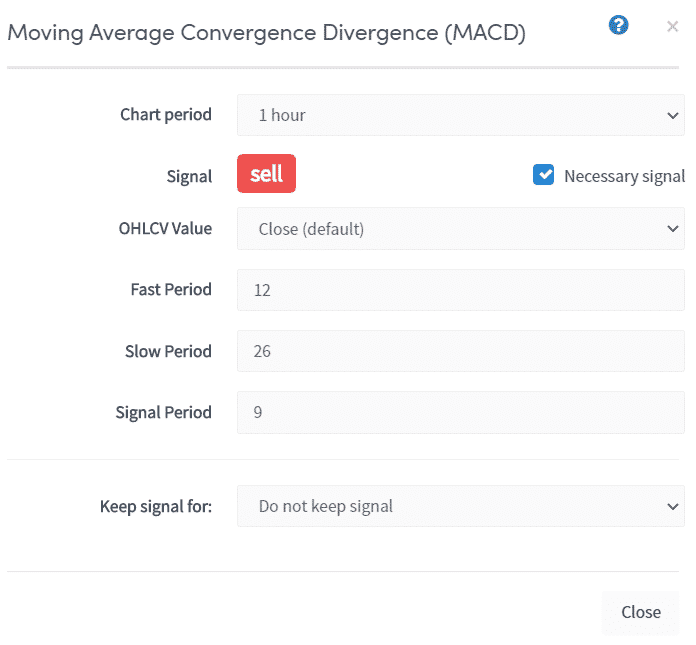
We will now add a sell indicator to this strategy to close positions. The MACD on the hourly chart should work here. To create a sell indicator instead of a buy, simply click on the green “buy” button in the menu for the particular indicator. This will change the signal to “sell”.
This is what it looks like when using Cryptohopper:
This is what the final version of the strategy looks like:
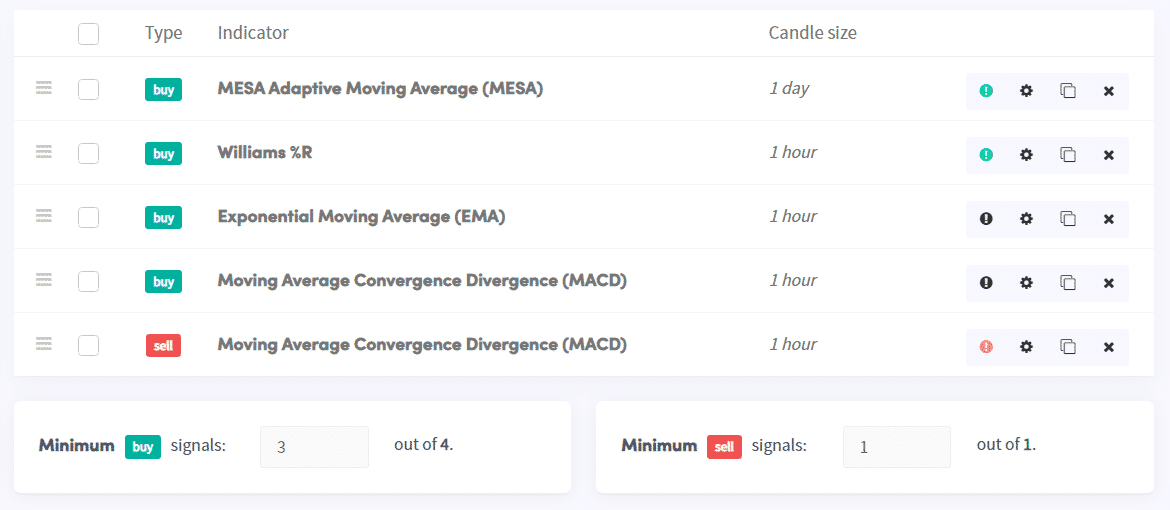
This is what the final version of the strategy looks like: