The table is divided into two columns:
|
(1) |
(2) |
|
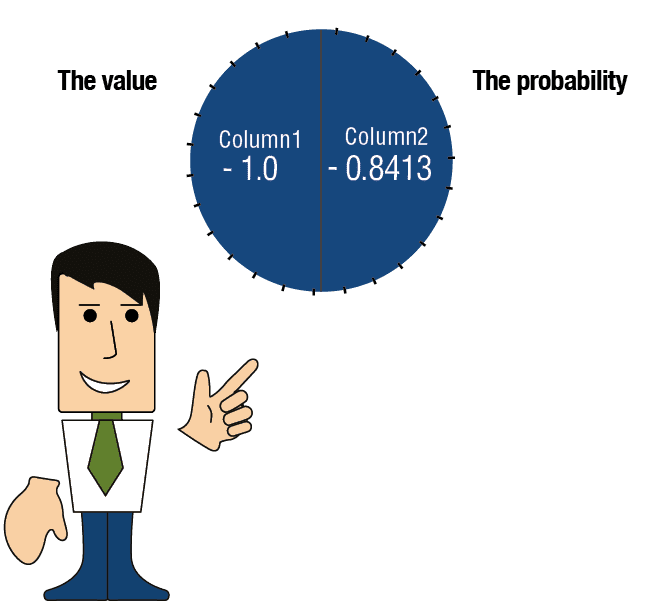
The value (in terms of the standard deviation) |
The probability (=the area under the curve to the left of the value) |
|
-2.5 |
0.0062 |
|
-2.4 |
0.0082 |
|
-2.3 |
0.0107 |
|
-2.2 |
0.0139 |
|
-2.1 |
0.0179 |
|
-2.0 |
0.0228 |
|
-1.9 |
0.0287 |
|
-1.8 |
0.0359 |
|
-1.7 |
0.0446 |
|
-1.6 |
0.0548 |
|
-1.5 |
0.0668 |
|
-1.4 |
0.0808 |
|
-1.3 |
0.0968 |
|
-1.2 |
0.1151 |
|
-1.1 |
0.1357 |
|
-1.0 |
0.1587 |
|
-0.9 |
0.1841 |
|
-0.8 |
0.2119 |
|
-0.7 |
0.2420 |
|
-0.6 |
0.2743 |
|
-0.5 |
0.3085 |
|
-0.4 |
0.3446 |
|
-0.3 |
0.3821 |
|
-0.2 |
0.4207 |
|
-0.1 |
0.4602 |
|
0.0 |
0.5000 |
|
0.1 |
0.5398 |
|
0.2 |
0.5793 |
|
0.3 |
0.6179 |
|
0.4 |
0.6554 |
|
→0.5 |
0.6915 |
|
0.6 |
0.7257 |
|
0.7 |
0.7580 |
|
0.8 |
0.7881 |
|
0.9 |
0.8159 |
|
→1.0 |
0.8413 |
|
1.1 |
0.8643 |
|
1.2 |
0.8849 |
|
1.3 |
0.9032 |
|
1.4 |
0.9192 |
|
1.5 |
0.9332 |
|
1.6 |
0.9452 |
|
1.7 |
0.9554 |
|
1.8 |
0.9641 |
|
1.9 |
0.9713 |
|
2.0 |
0.9772 |
|
2.1 |
0.9821 |
|
2.2 |
0.9861 |
|
2.3 |
0.9893 |
|
2.4 |
0.9918 |
|
2.5 |
0.9938 |
Column 1 – the value (expressed in terms of standard deviation):
The value in the first row is -3.0.
The value in the row below it is -2.9, which reflects an addition of 0.1 standard deviations.
The value in the third row is -2.8, which reflects a further addition of 0.1 standard deviations.
The table proceeds from row to row, with the value increasing by 0.1 standard deviations each time until the value in the final row
reaches 3.0 standard deviations.
Column 2 – probability (= the area under the curve to the left of the value).
Each row denotes the area under the curve to the left of the value.
Examples:
Question: What is the probability of obtaining a value less than 1?
The answer is 0.8413.

We look at the table in the row of the value 1.0.
The number appearing to the right of 1.0 in Column 2 (0.8413) is the probability, meaning that there is a 0.8413 chance of obtaining values below 1. In other words, the probability is greater than 84.13%
Question: What is the probability of obtaining a value less than 0.5?
The answer is 0.6915.

Explanation:
We look at the probability appearing in Column 2 next to the value 0.5.
Standard Probability Table